Shubham Singla
In this work, I’m representing how I design the overall structure for a data science course, not only to generate the revenue, but also to really help the users to identify the best for them.
IMP - To comply with the NDA, some design process and design details will not be shown.
P.S. - The whole case study could be little content heavy, please bear with me, I tried to put the important stuff only 😅
Brief Overview
We at Scaler, had different programs going on for professionals & students for mastering tech jobs, we decided to launch one program related to Data Science & ML as well, for the same we had to layout the strategy and need to design the overall structure that leads to more growth at Scaler. GO checkout the live website here .
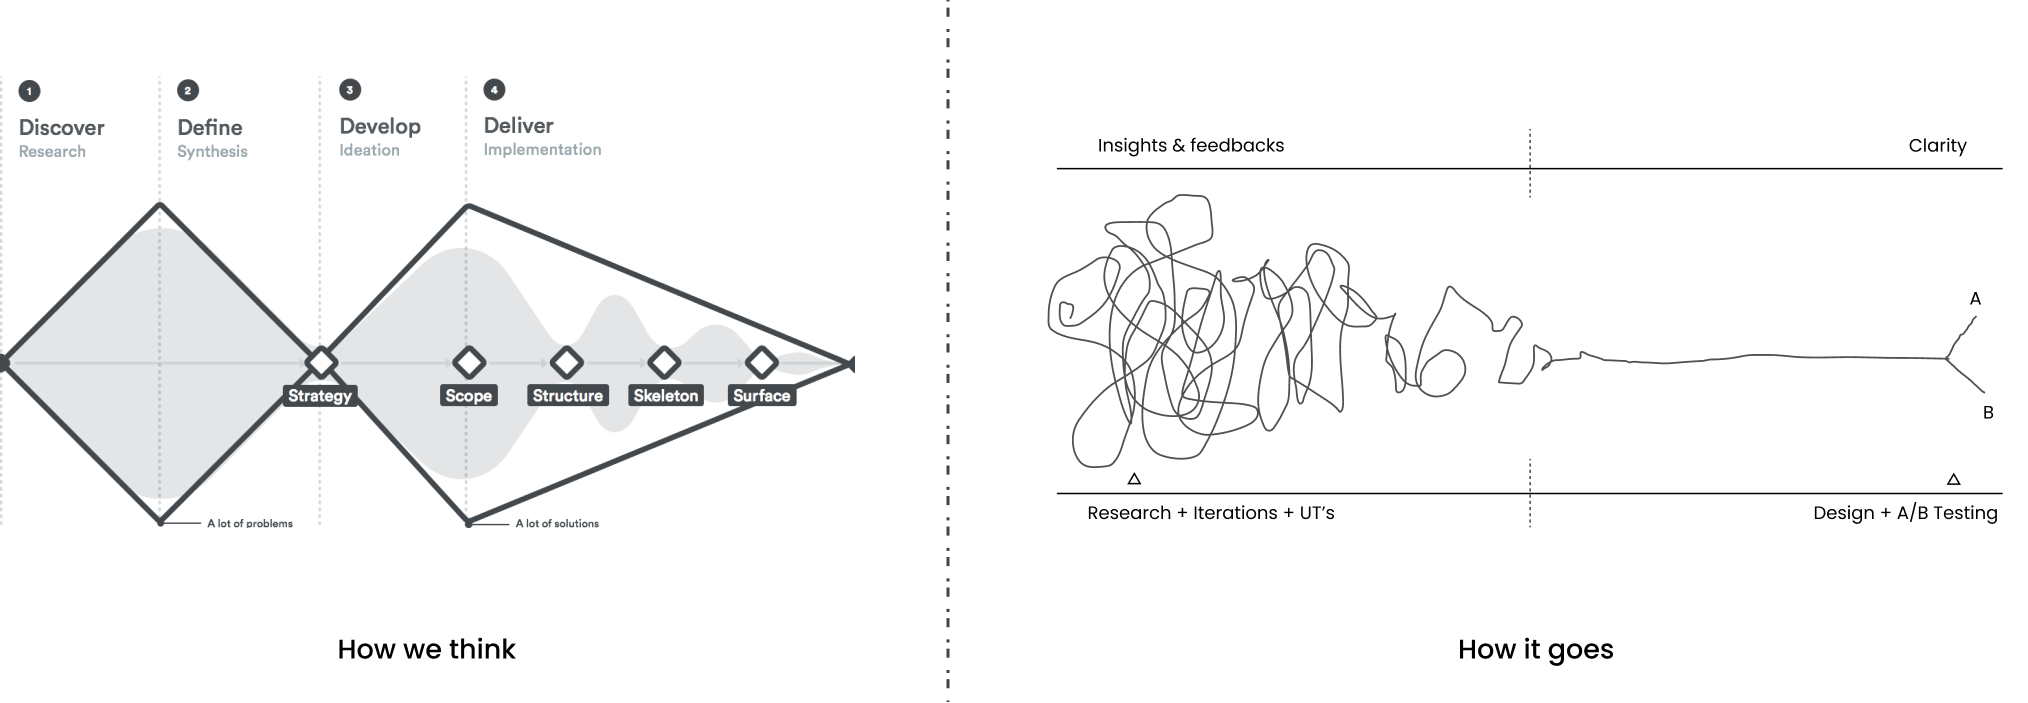
Initially we had an understanding of what we need to build, but we don’t know what exactly are the needs of our users or what are the things that may help us in changing the way user thinks about a paid course. So, initially we had a few questions in our mind -
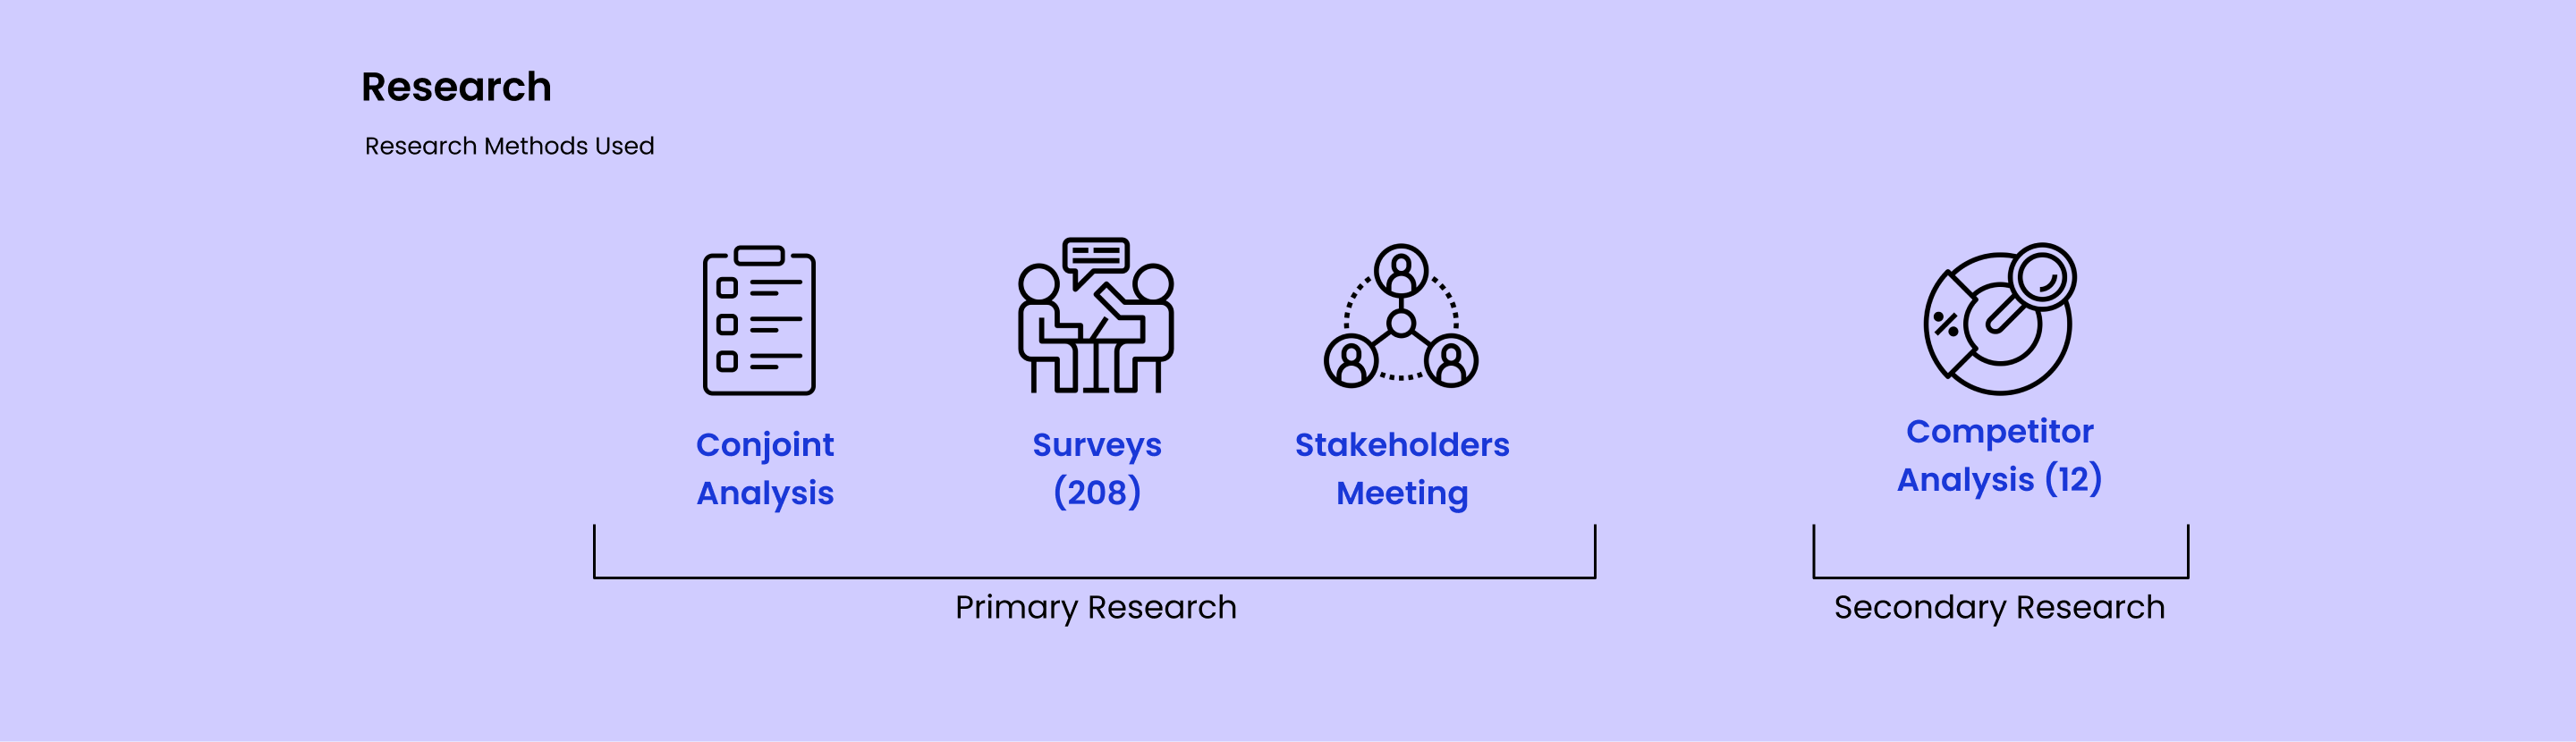
We definitely do had a lot more questions, and we know research could be the only option to get answer to all those questions we had. So, here are the respective steps we followed -
Hided a few details here and also couldn’t display the overall research due to NDA
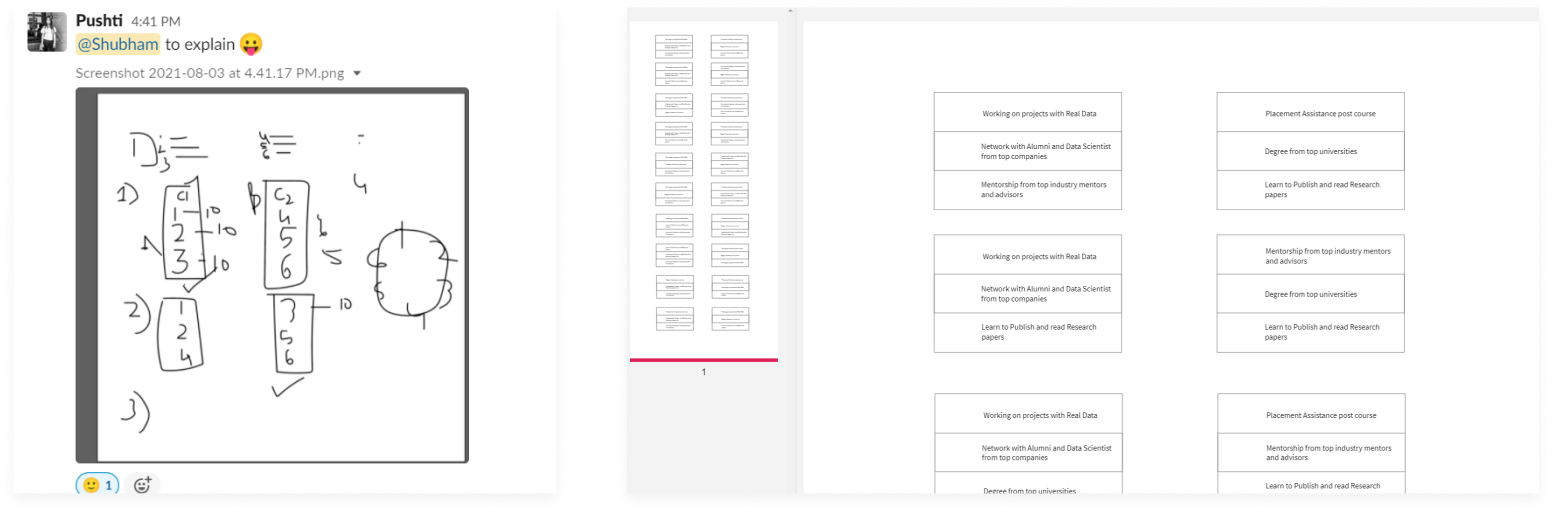
Here’s how we finally prepared different choices to choose from(2nd img) & yes we need to apply Permutaions & Combinations(1st img) into it :P
I’ll quickly try to explain what we did here, so in this we had 6 different choices to ask from the users, accordingly we grouped different choices & again grouped them together in 3, this way he had a total of 20 groups (user needs to choose from a set of 2 choices, 10 times) and by doing so in the end we would be having some data, and after calcultions we can analyse what are the most important things for a user. But this method FAILED in the end, when we analyse results.
This method didn’t work out well as we expected, we got biased responses from this, due to large number of choices people started filling randomly, which we got to know after analysing the whole data, thus we stopped this and moved further with the user surveys.
An upper hand for us as people are actually considering learnings and skills over a degree/certificate, also from this we got to know people(73%) are really interested in learning Data Science & ML.
Survey Link - https://qp3c921jeod.typeform.com/to/eUsSwYQb
Now after spending a good time on research and finding the right information, it’s time to list down the findings -
We found that, users are very interested in doing practical projects, because in Data science, one play with large number of data, so user wants the data should be real and projects should be taken up from real life scenarios, so we tied up with big companies like Zomato, Uber etc. to get the real data.
One important insight that we found is, users are very interested in knowing how to read and publish a research paper. Even this is one of the important USP, that stand us apart from the competitors. These small findings are what that makes a course more successful.
Certificates are something that sometimes play an important role, especially when it’s recognised from the top universities, but what we found is users preffered mentors, instrutcotrs & advisors more than a certificate, which is even a good sign how tech industry is changing.
As this course is for people who’re already working in tech-industry, we found that these people are more interested in knowing the curriculum in very detail, so we priotised that and had defined the curriculum detailed in our design.
One of the major factor that comes before buying any course is trust, in research we found that people buy more if someone recommends the course to them (Mouth-marketing), so we also want to build that kind of trust via our course.
There are some more insights that helps us in moving forward , but here I try to highlight the important ones :)
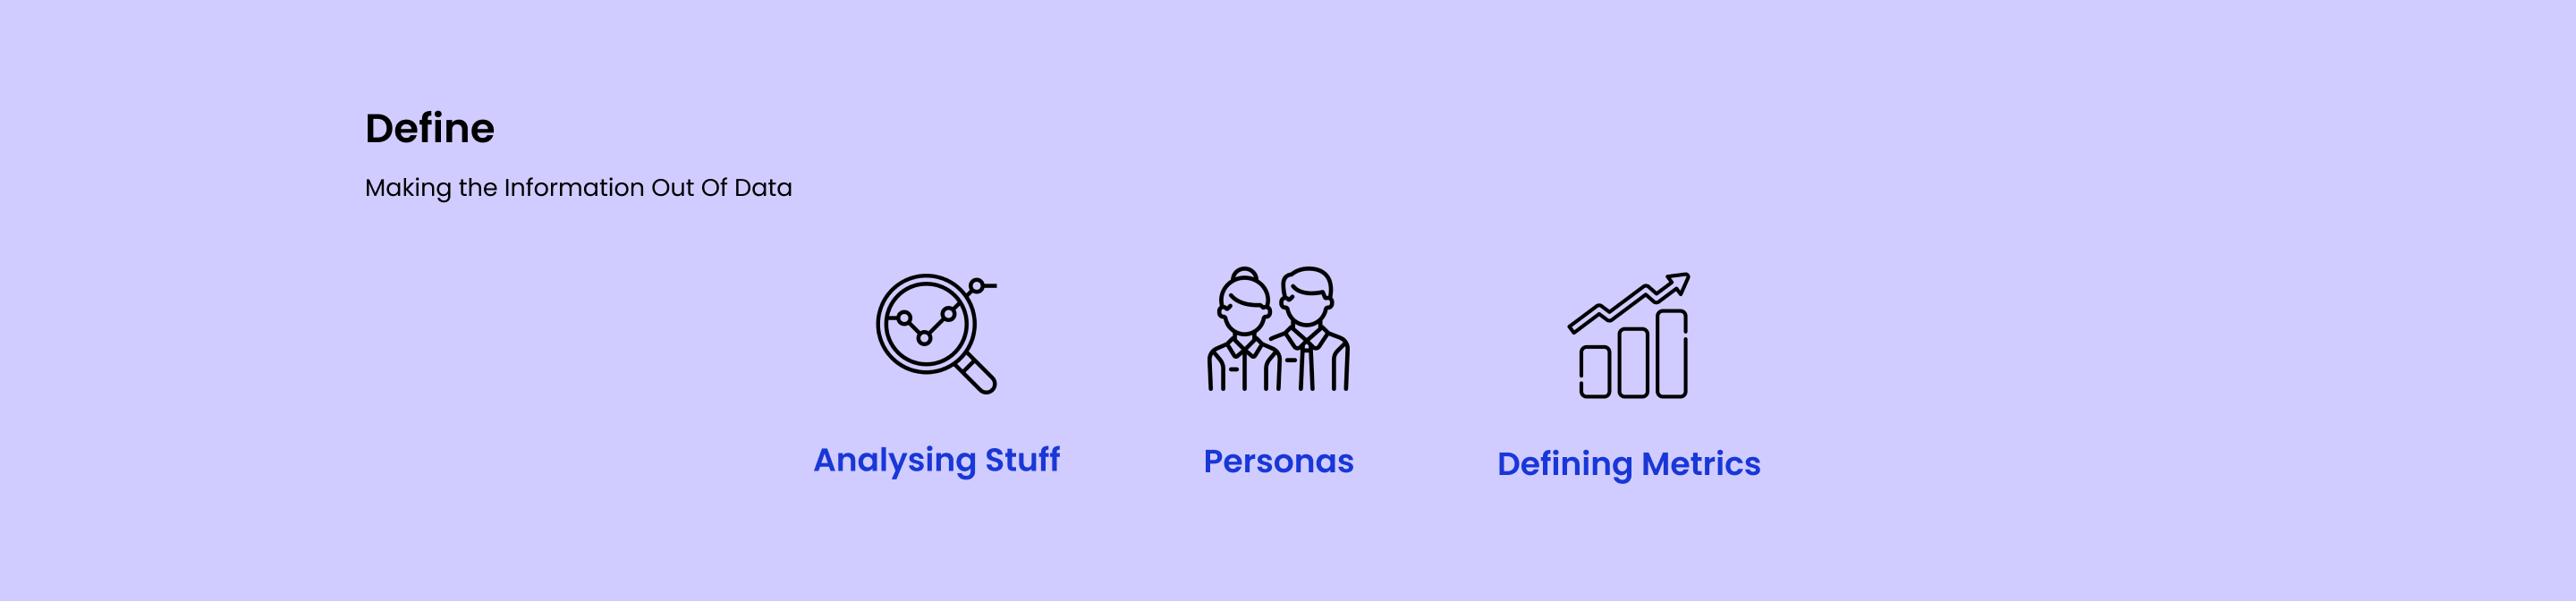
We got some good insights after doing research, now we shared the research insights with our stakeholders to get their views/feedbacks, asking initial feedback is so much important at every stage, because it allows us to iterate more and deliever better. After this, we need to clearly define things and make the right information out of the data we collected.
Although we’re targetting only working professionals, but under them also we have categorised our users under different segements, depending on the their current occupation & needs and here are three different personas that we created to better understand every user needs and their pain points -
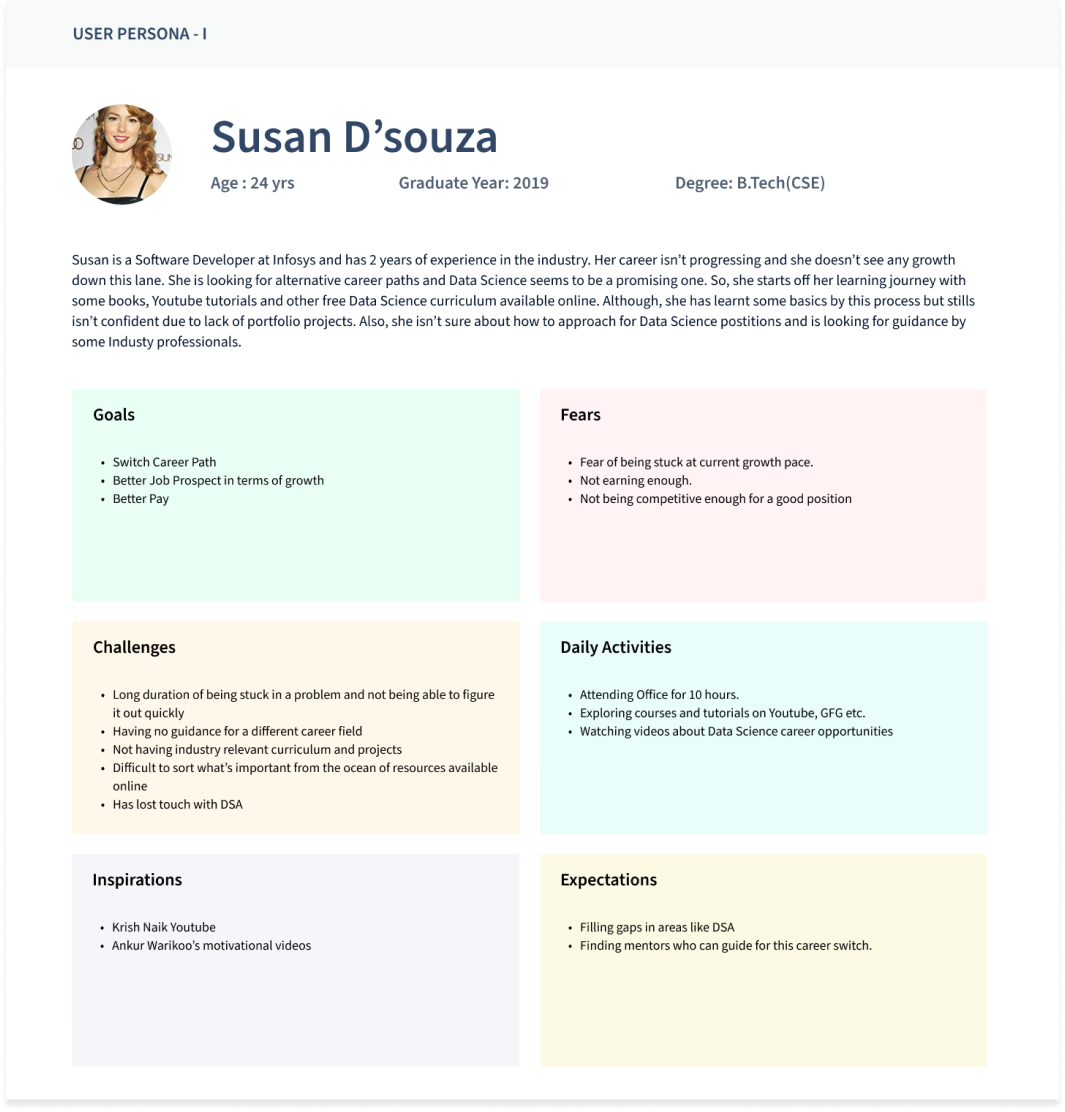
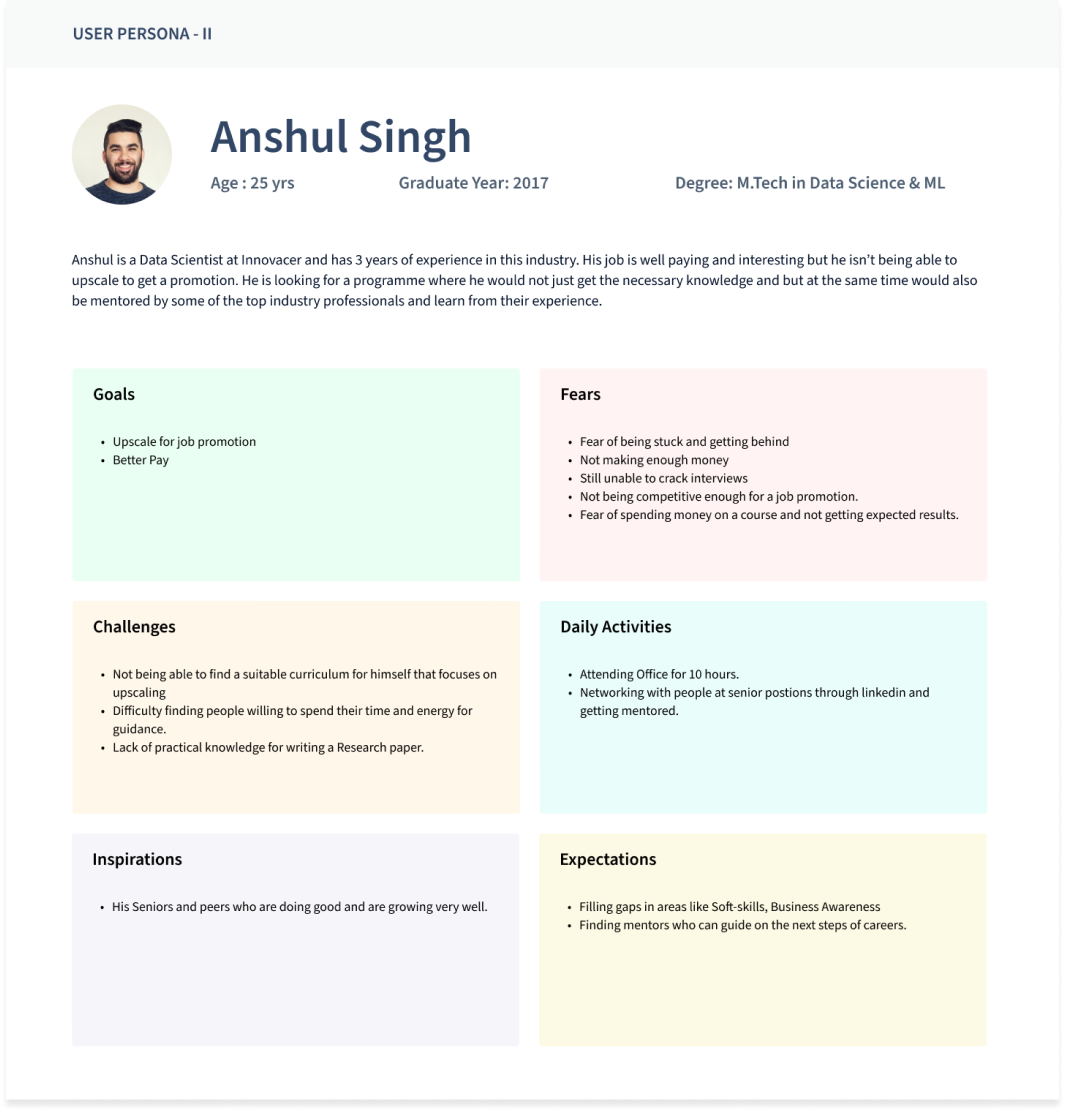
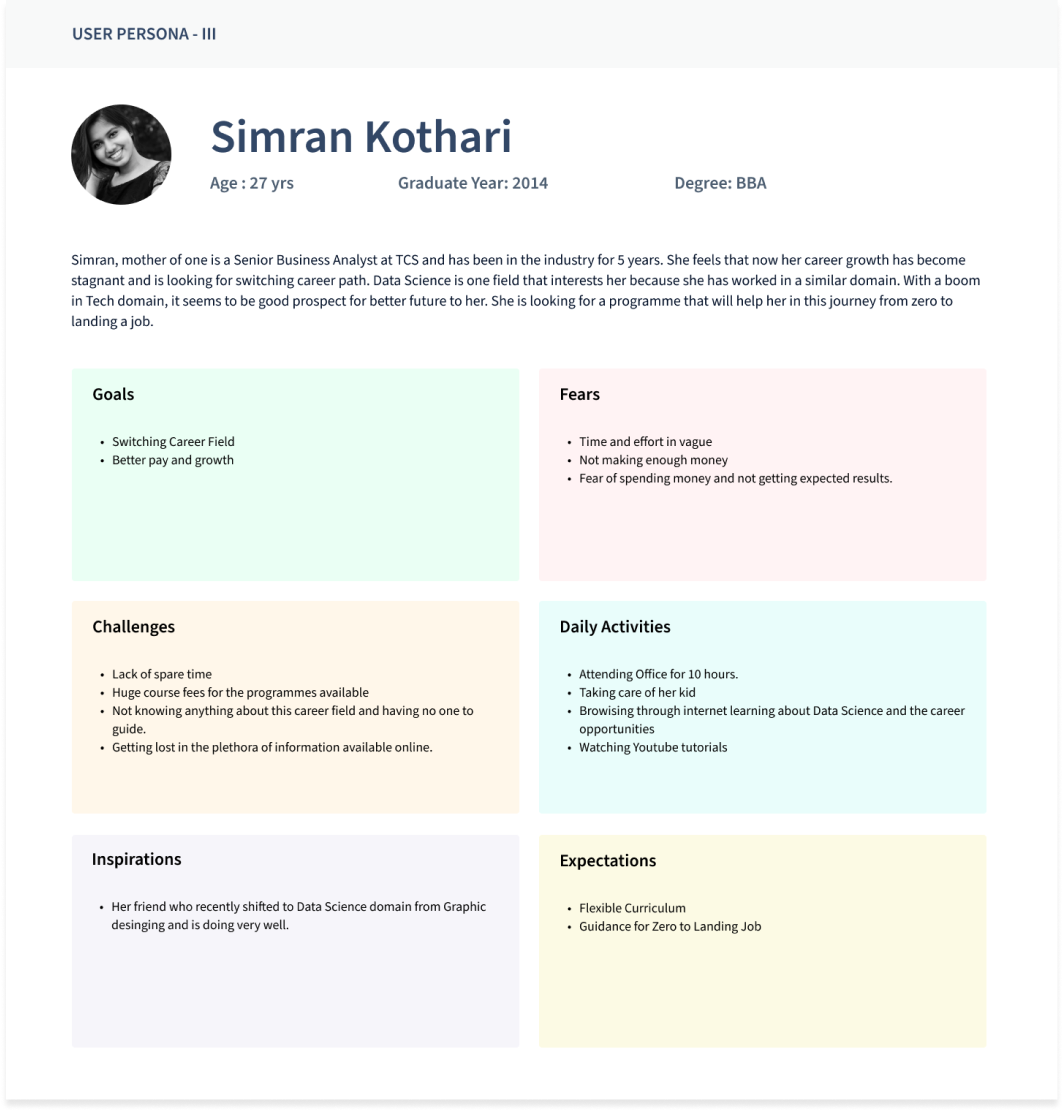
Empathising with users is crucial, without knowing them by heart building product is difficult :)
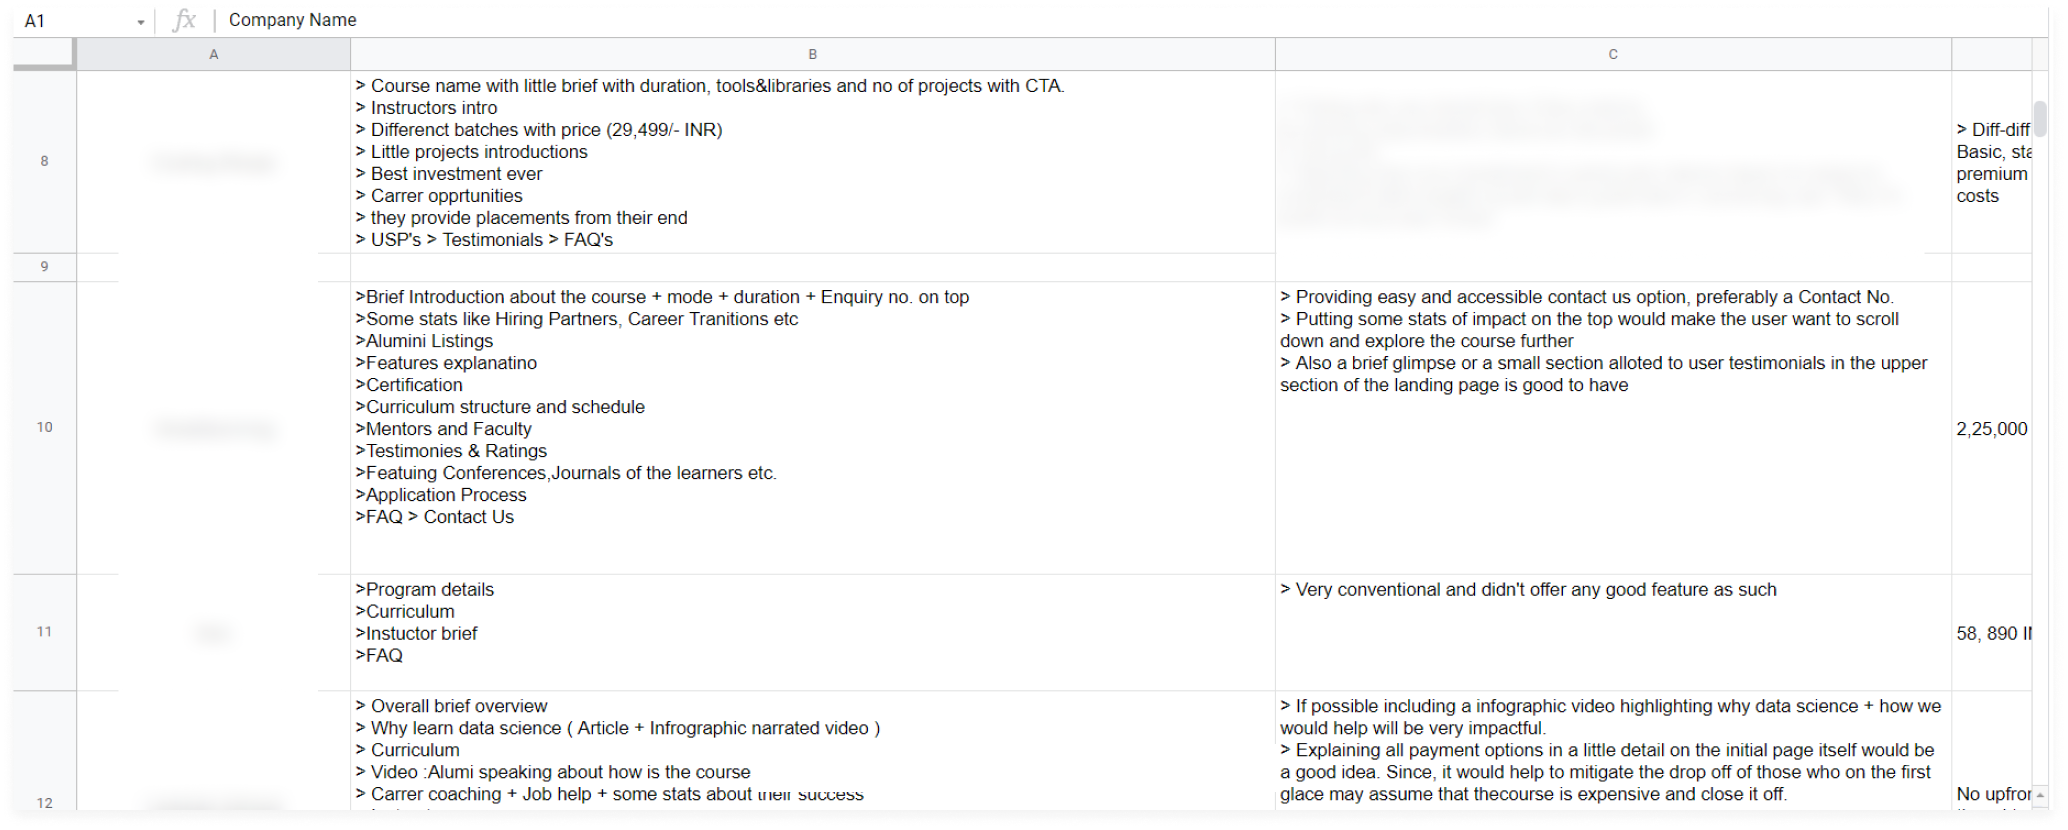
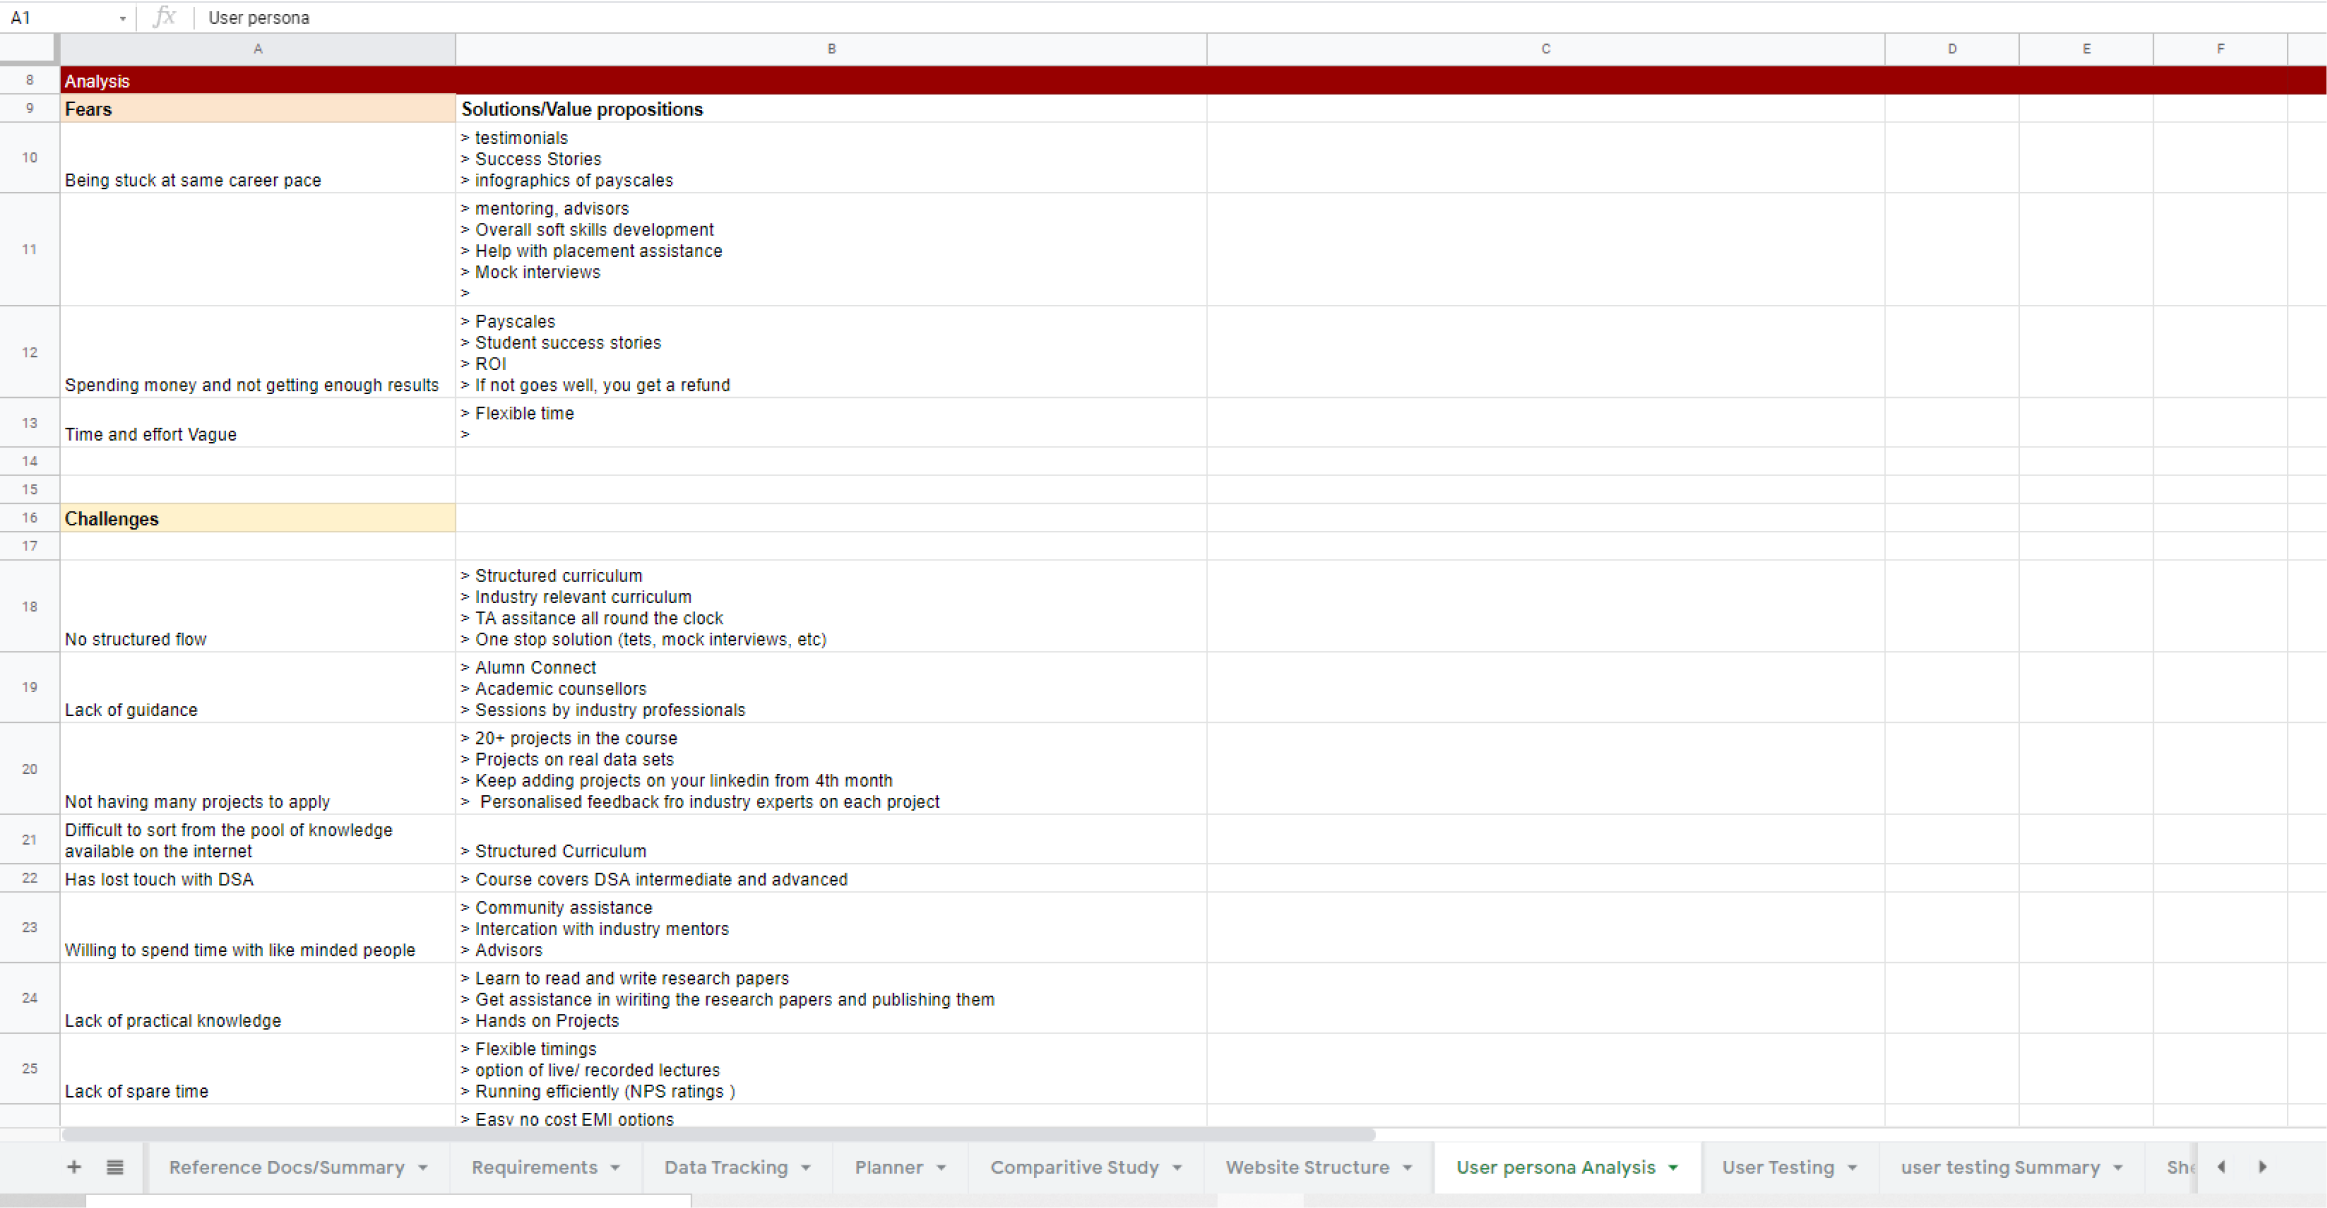
Based on these User persona problems, we laid out solution for each of them in a sheet, a small view of it can be seen below -
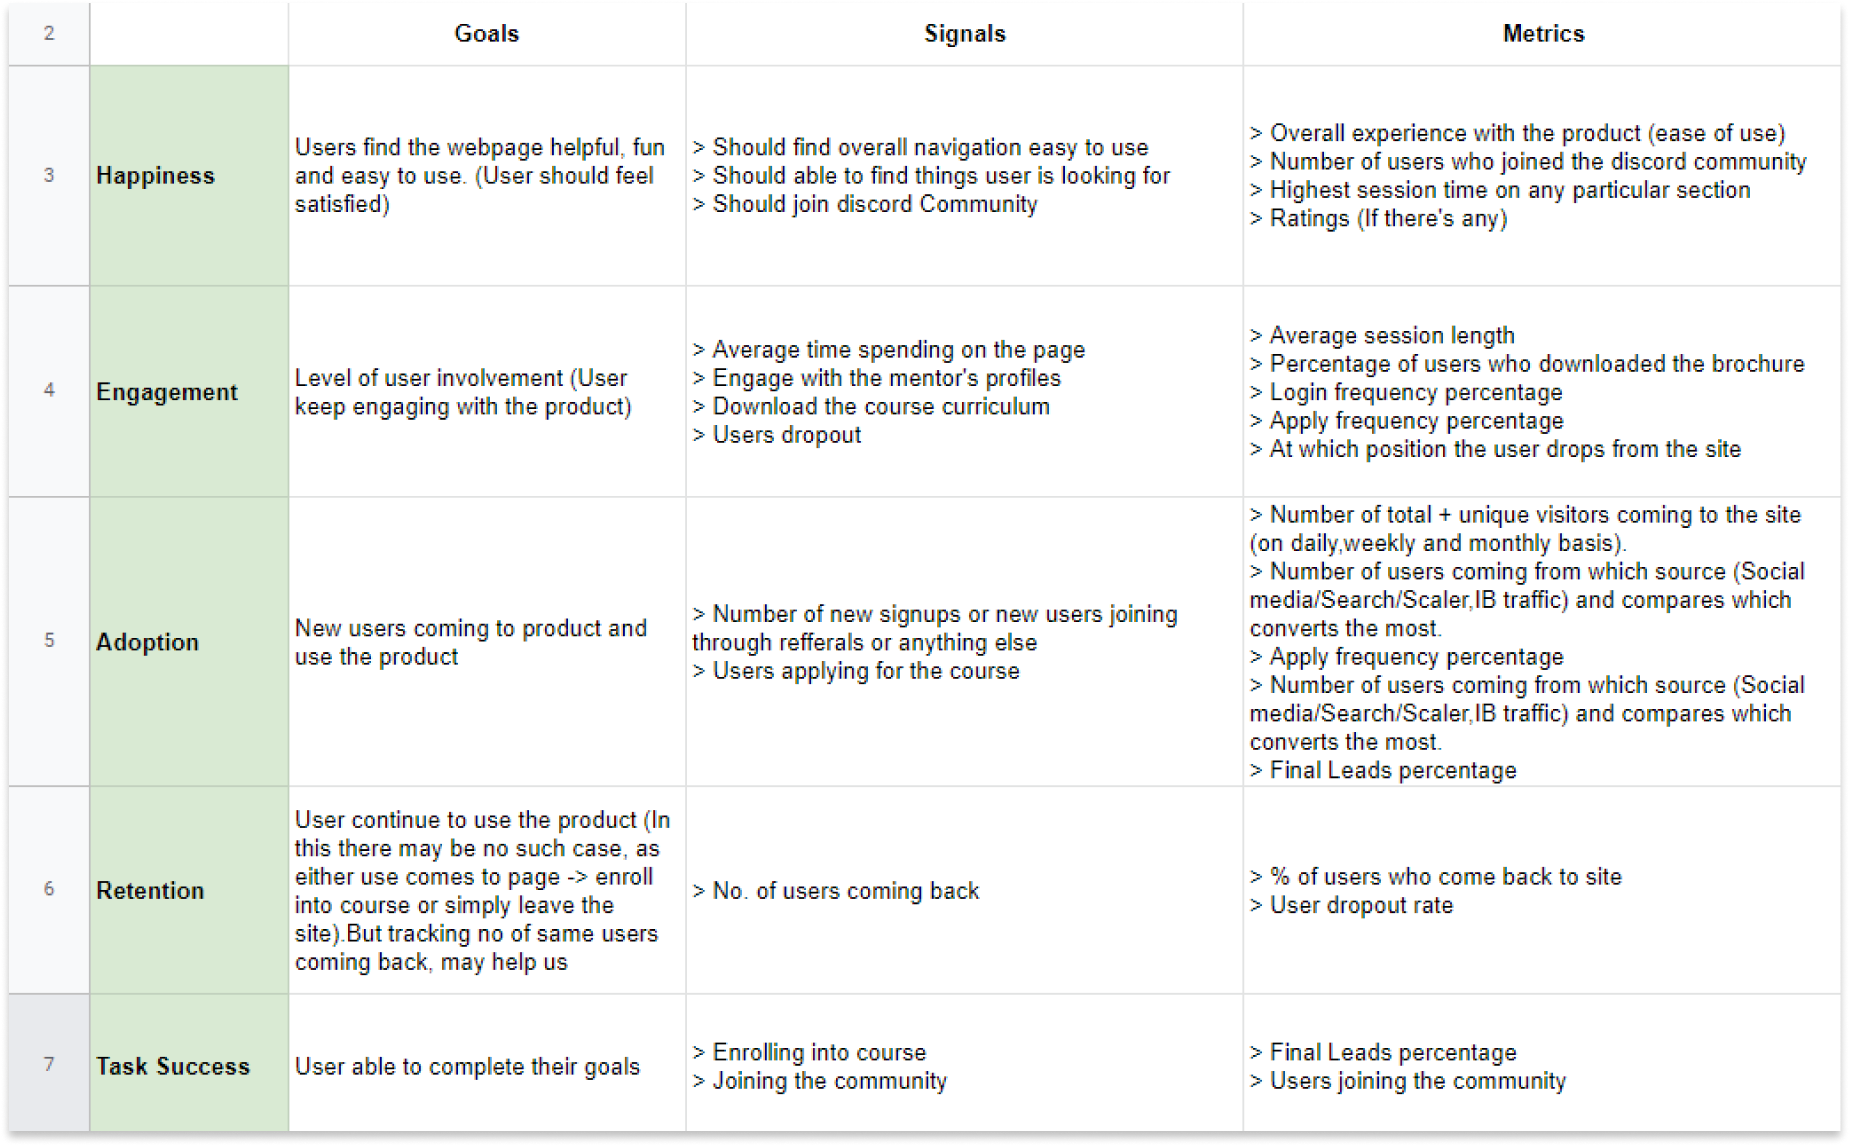
Now we do have some understanding of what a user needs and probably how we can provide them, but before jumping into building wireframes, we want to define a few metrics for the product, so here we used HEART framework to define those metrics -
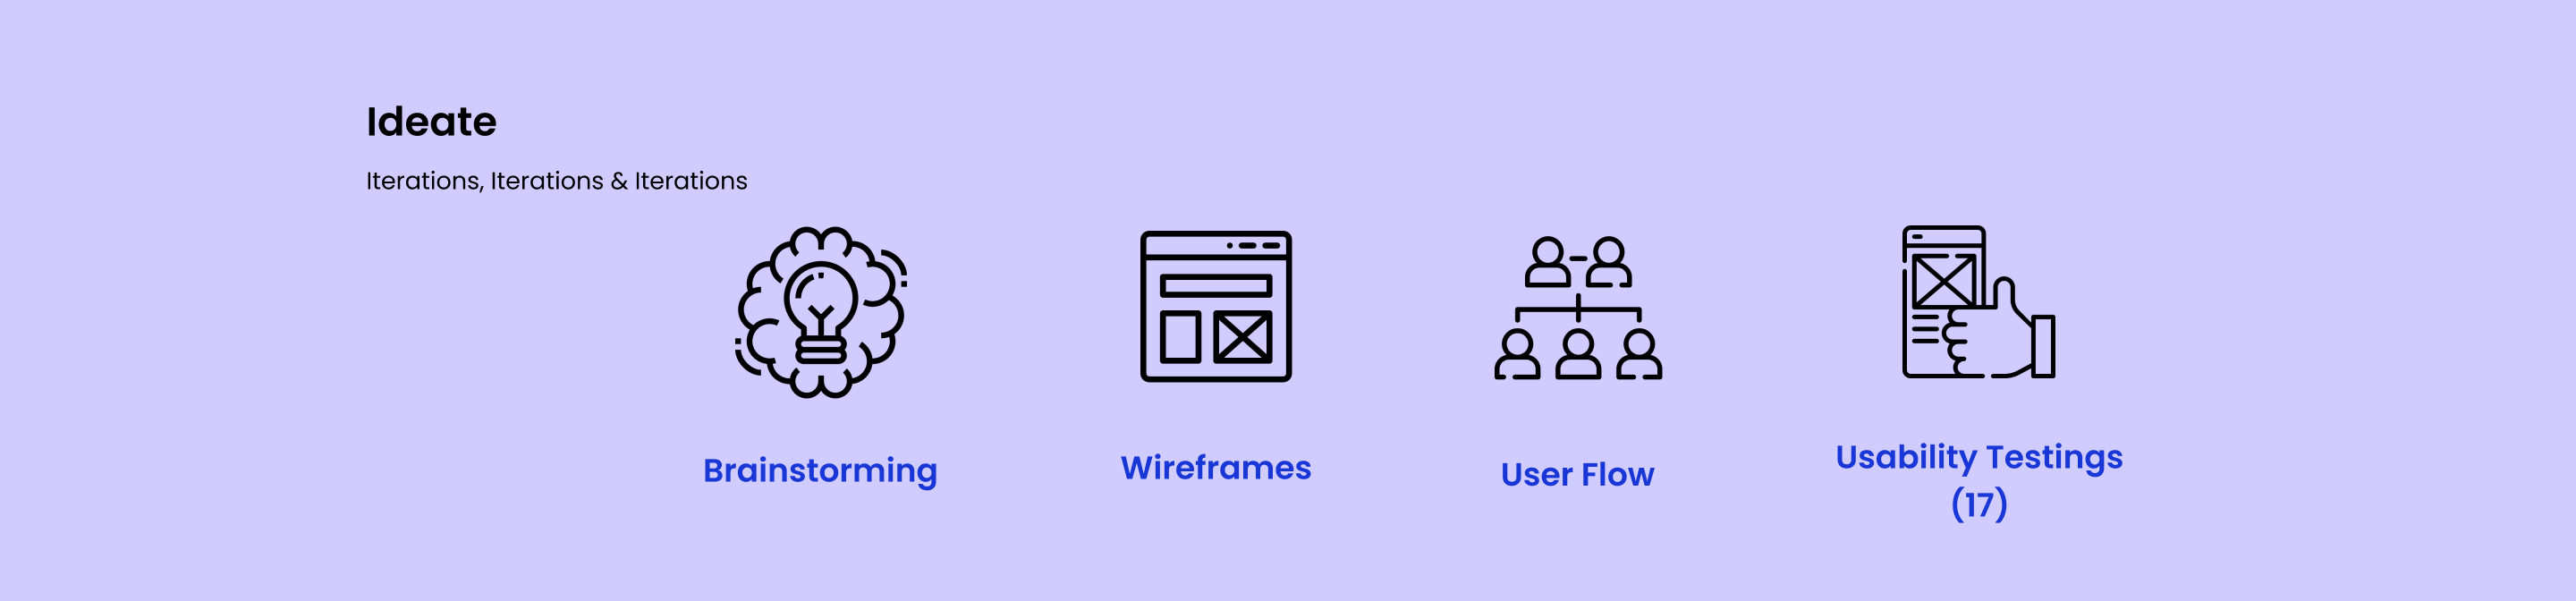
Here comes one of the interesting part of the whole design process, where we started making something for the end user. After summarizing overall research we do have an idea of what our users want, so we started off with brainstorming, thinking of different structures/layout to represent the overall data.
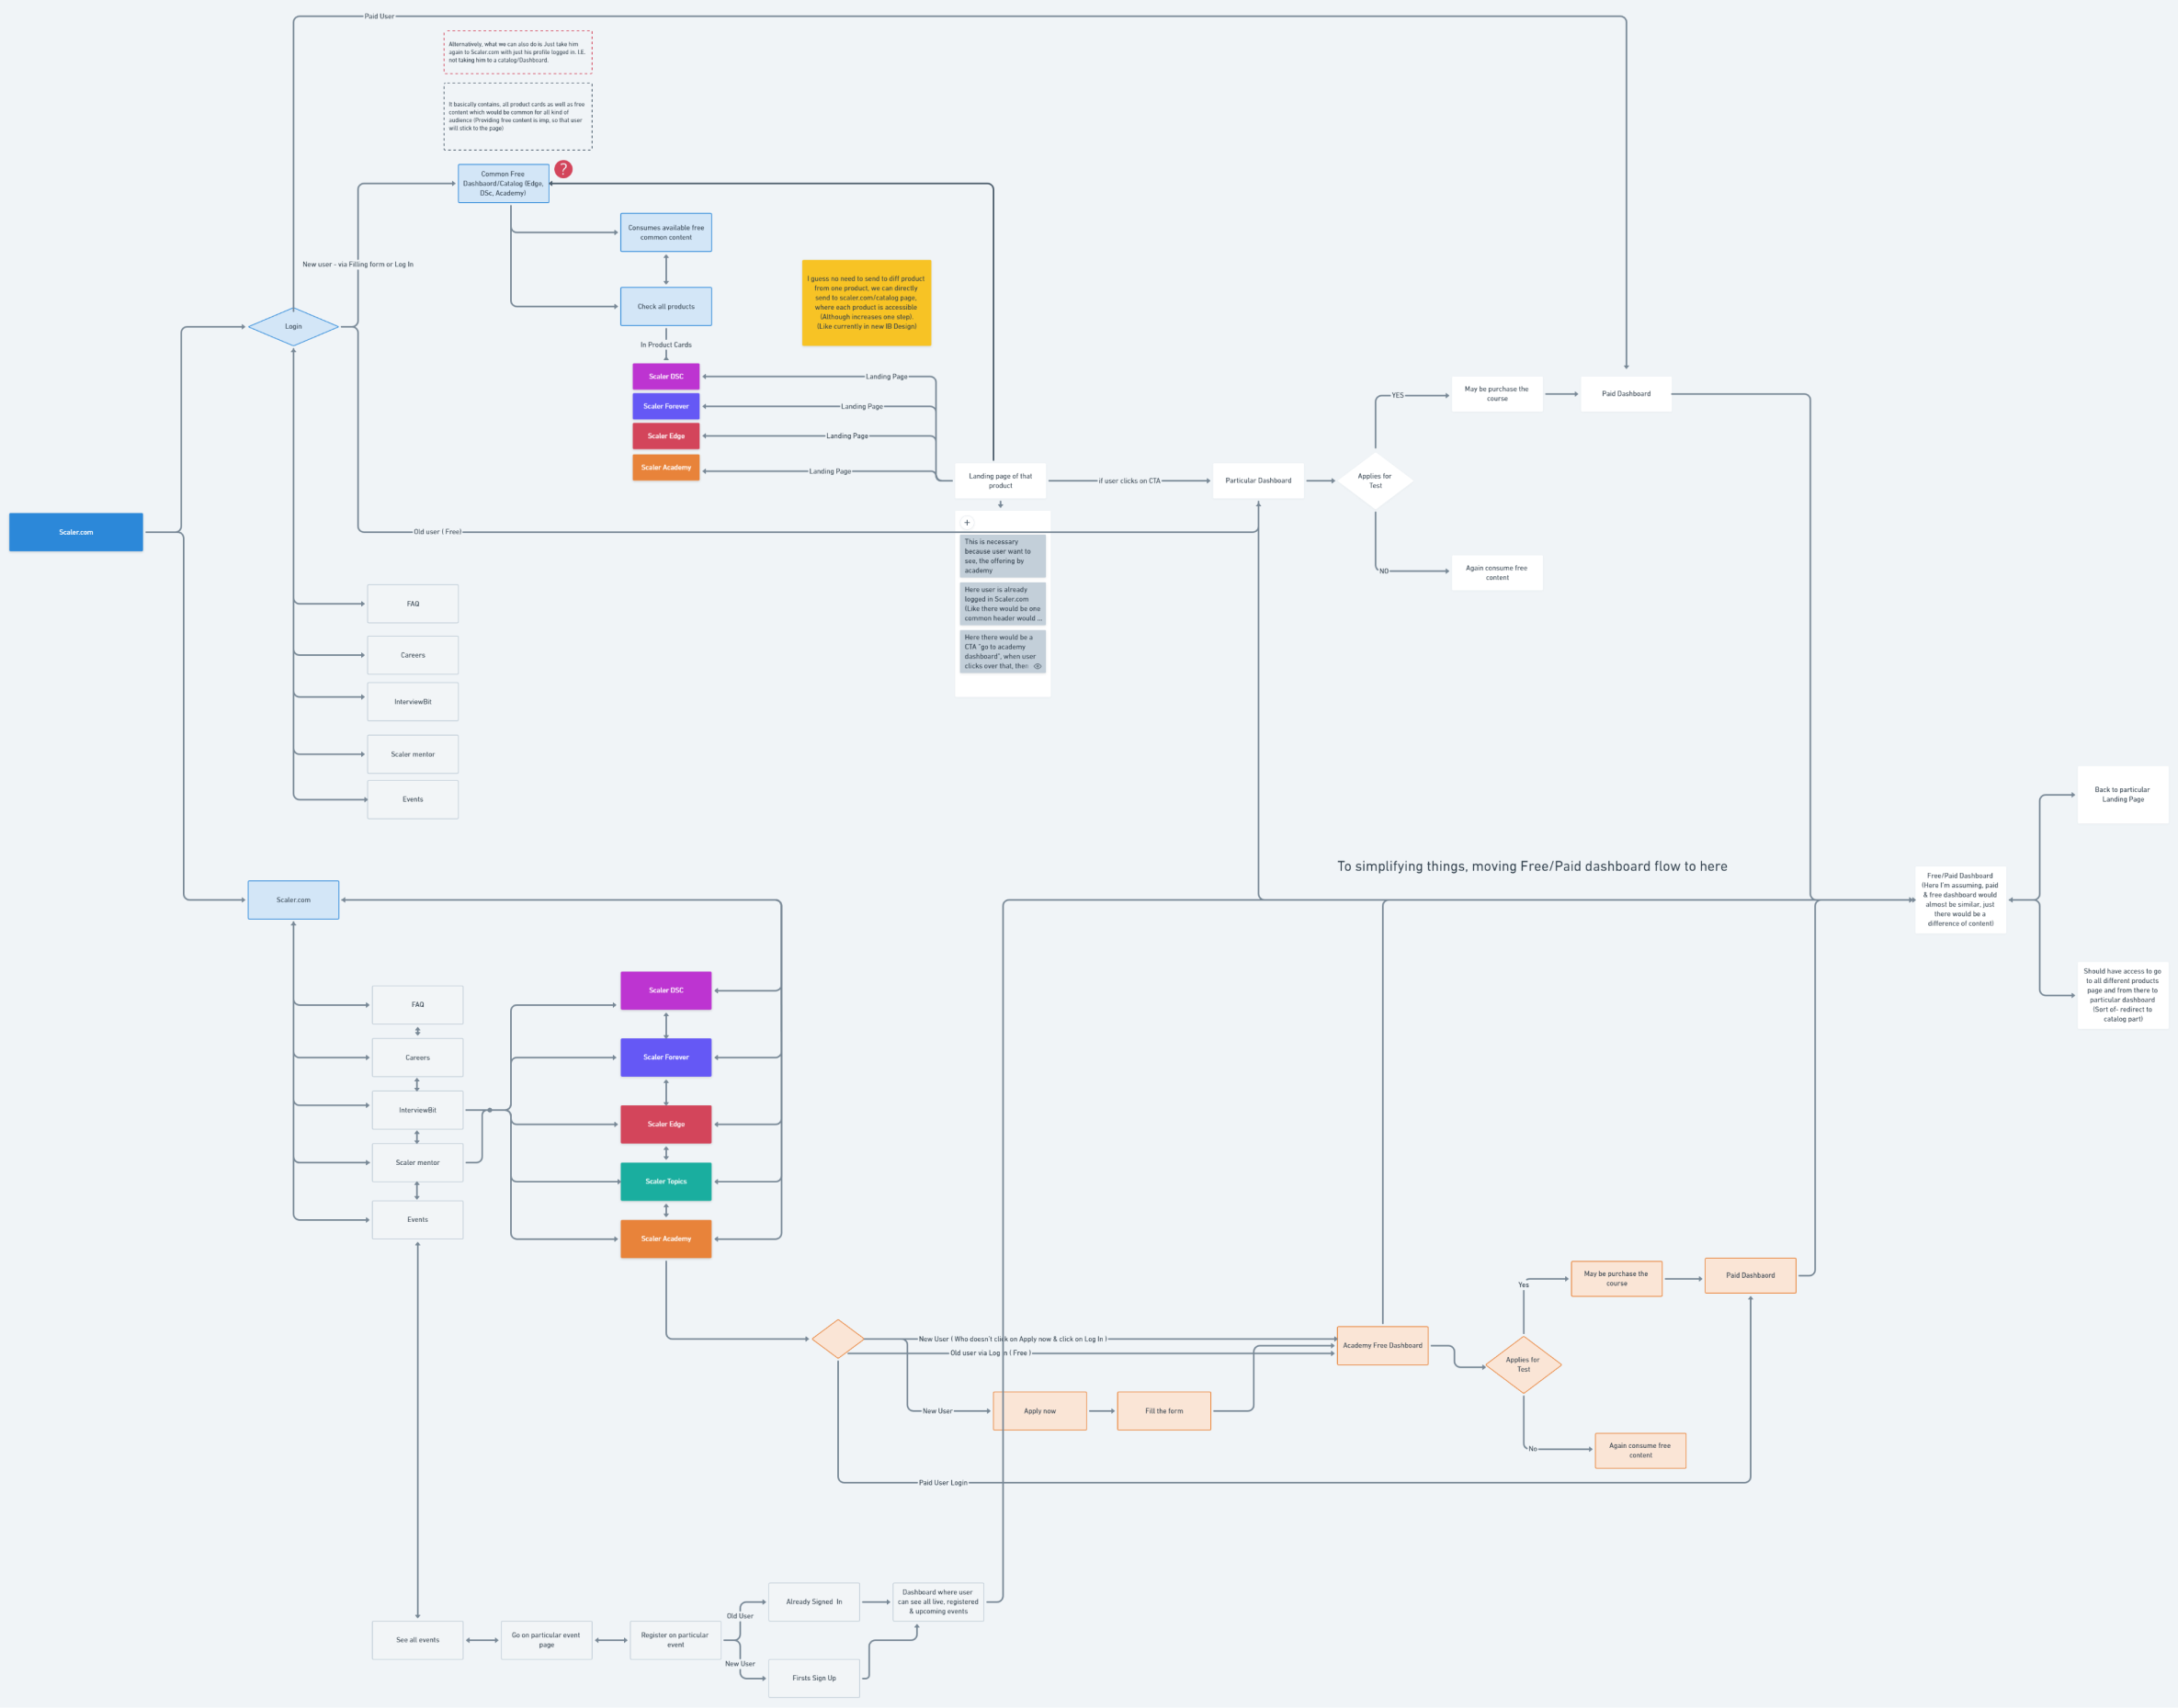
We first build the user flow, this is based upon how should we integrate the whole Data Science program with Scaler products, as we had diff-diff products and making a separation from all of them is necessary. Here’s how the flow looks like -
We wanted to build the whole website in a way, that speaks up for itself and engage the user via storytelling. Considering all these factors, we build some wireframes and started with Usability Testings to validate those.
These are wireframes we had created after multiple iterations, here I’ve divided them itno 3 parts to show the whole design
Now after building this, we started with Usability Testing, we reached out to sales team to get some folks for the UT’s. Once we got the right users, we mailed & informed them about UT’s and thus proceeded with the same. We don’t only just test our product, but this is more of a talking with the users, as this helps in understanding their general needs more, that might remain uncover in Research phase.
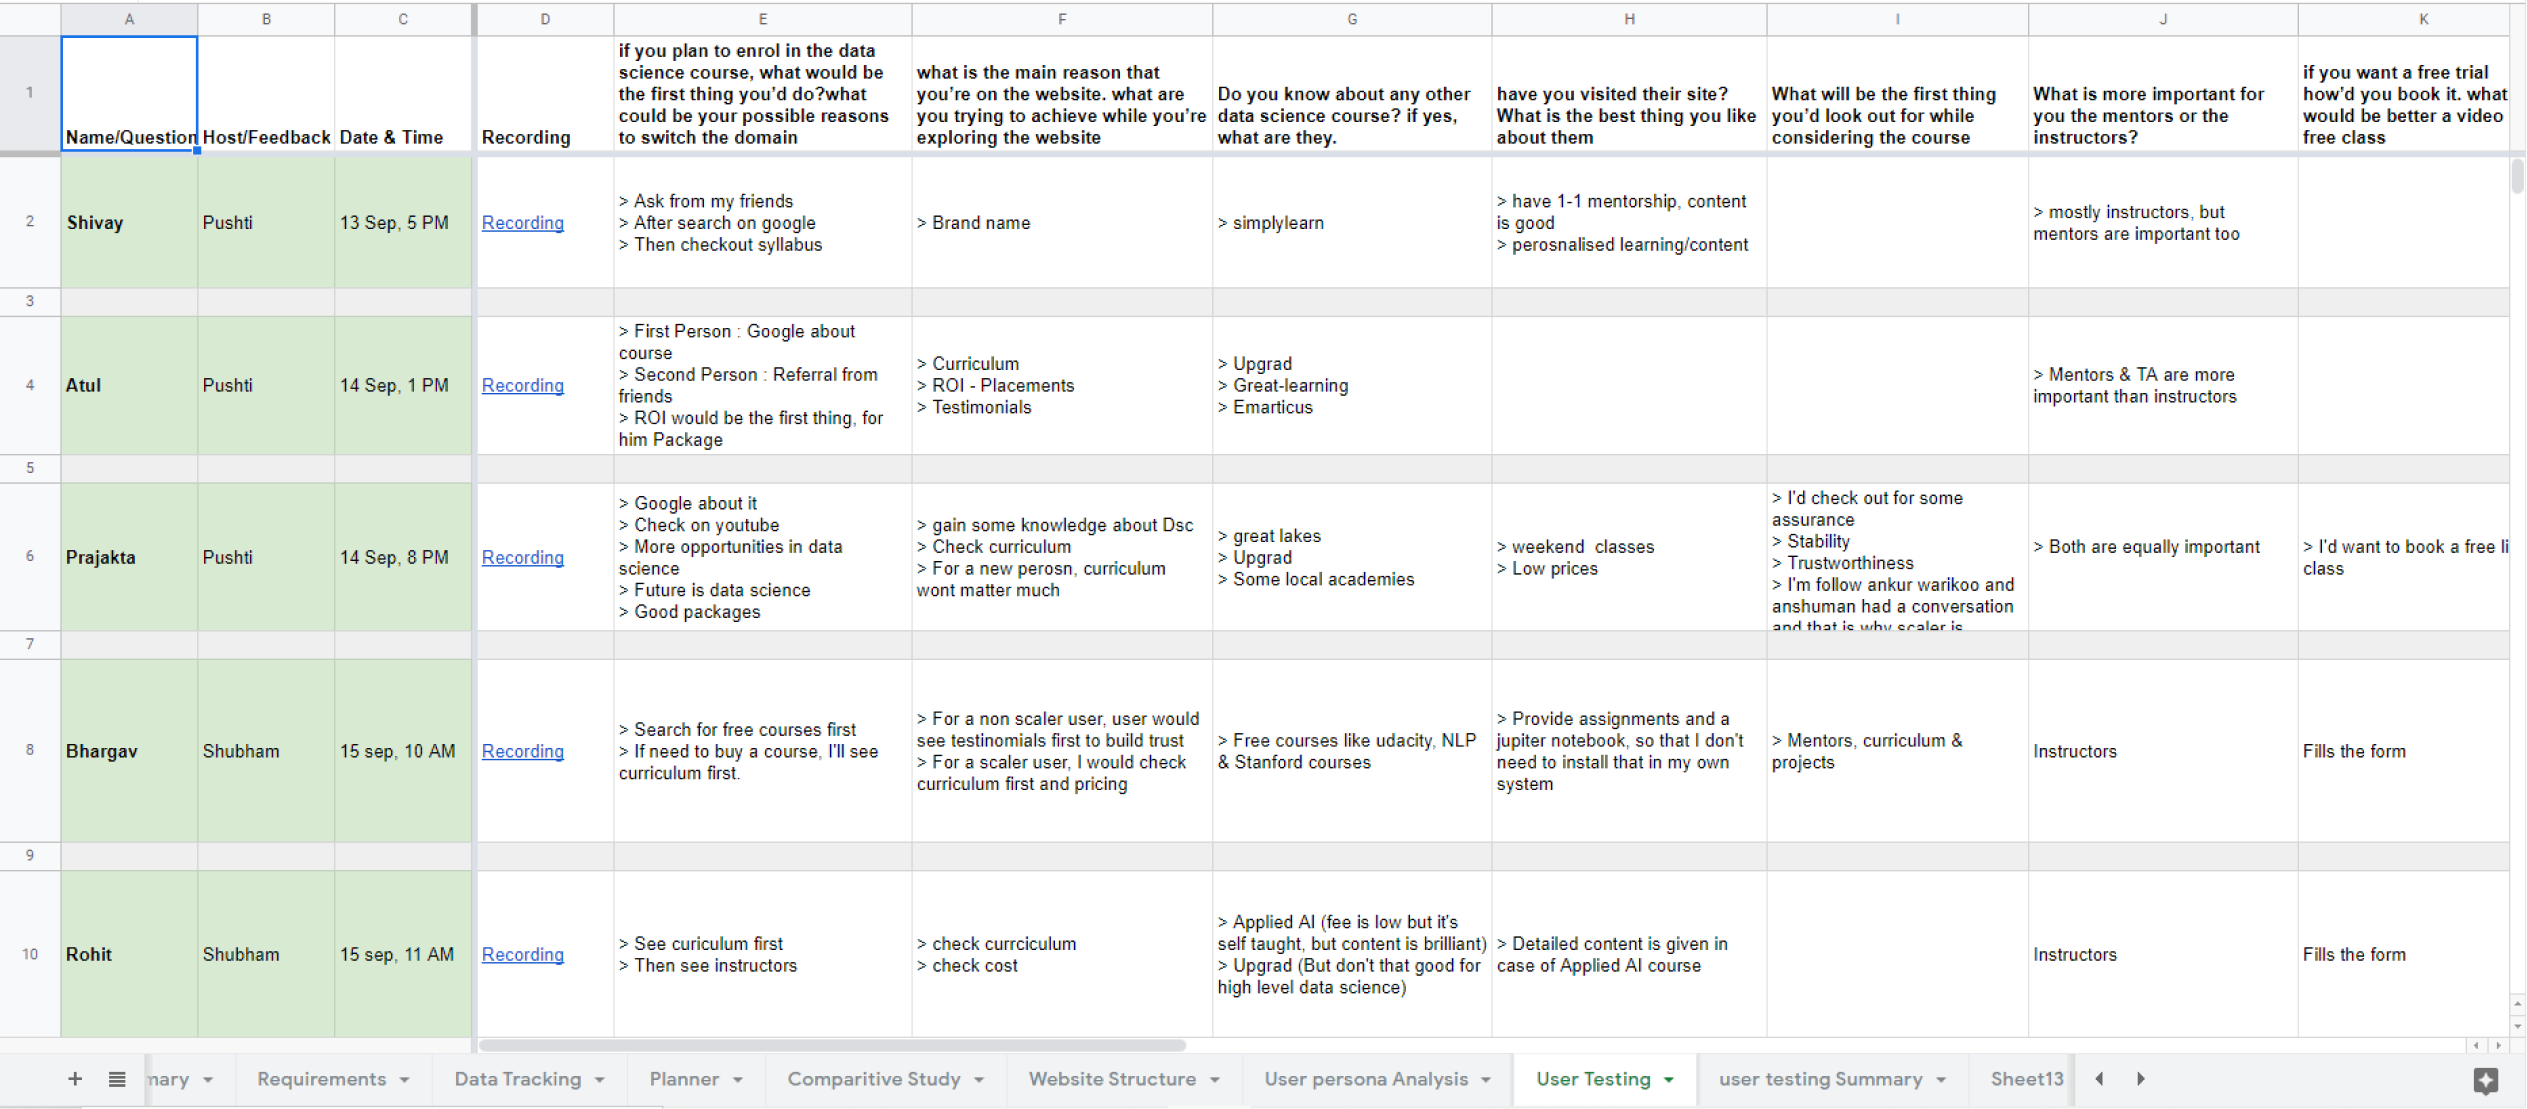
A short glimpse to the Usability Testings we did :)
We talked with a total of 17 users, who all are professionals working at diff organisations. After this, we recorded responses of them and analyse all recordings. Major findings that we need to work upon -
While doing Usaility Testing’s we understand, that the users also wants to see some beginner friendly content, not all visitors coming to the site are pro at Data Science. Users wants to see some basic blogs, videos etc.
We analysed that few of the users, quickly skims through content, so we decided to give answers a big format, so that they can have a look and read the content along.
Along with a detailed curriculum users wants to see the detailed projects as well, according to them a good description of projects should be there, it helps them to better understand the course.
So, at Scaler we do have mentors, instructors, advisors & TA’s for the students to help them throughout the course. We want to figure out acording to students who are most important for them, we found that users consider Instructors to be more important then a mentor, so this helps us in building design accordingly.
We asked from users, if you need to rate the work (Not visually), then how much you rate that, avergae rating comes out to be 8.6.
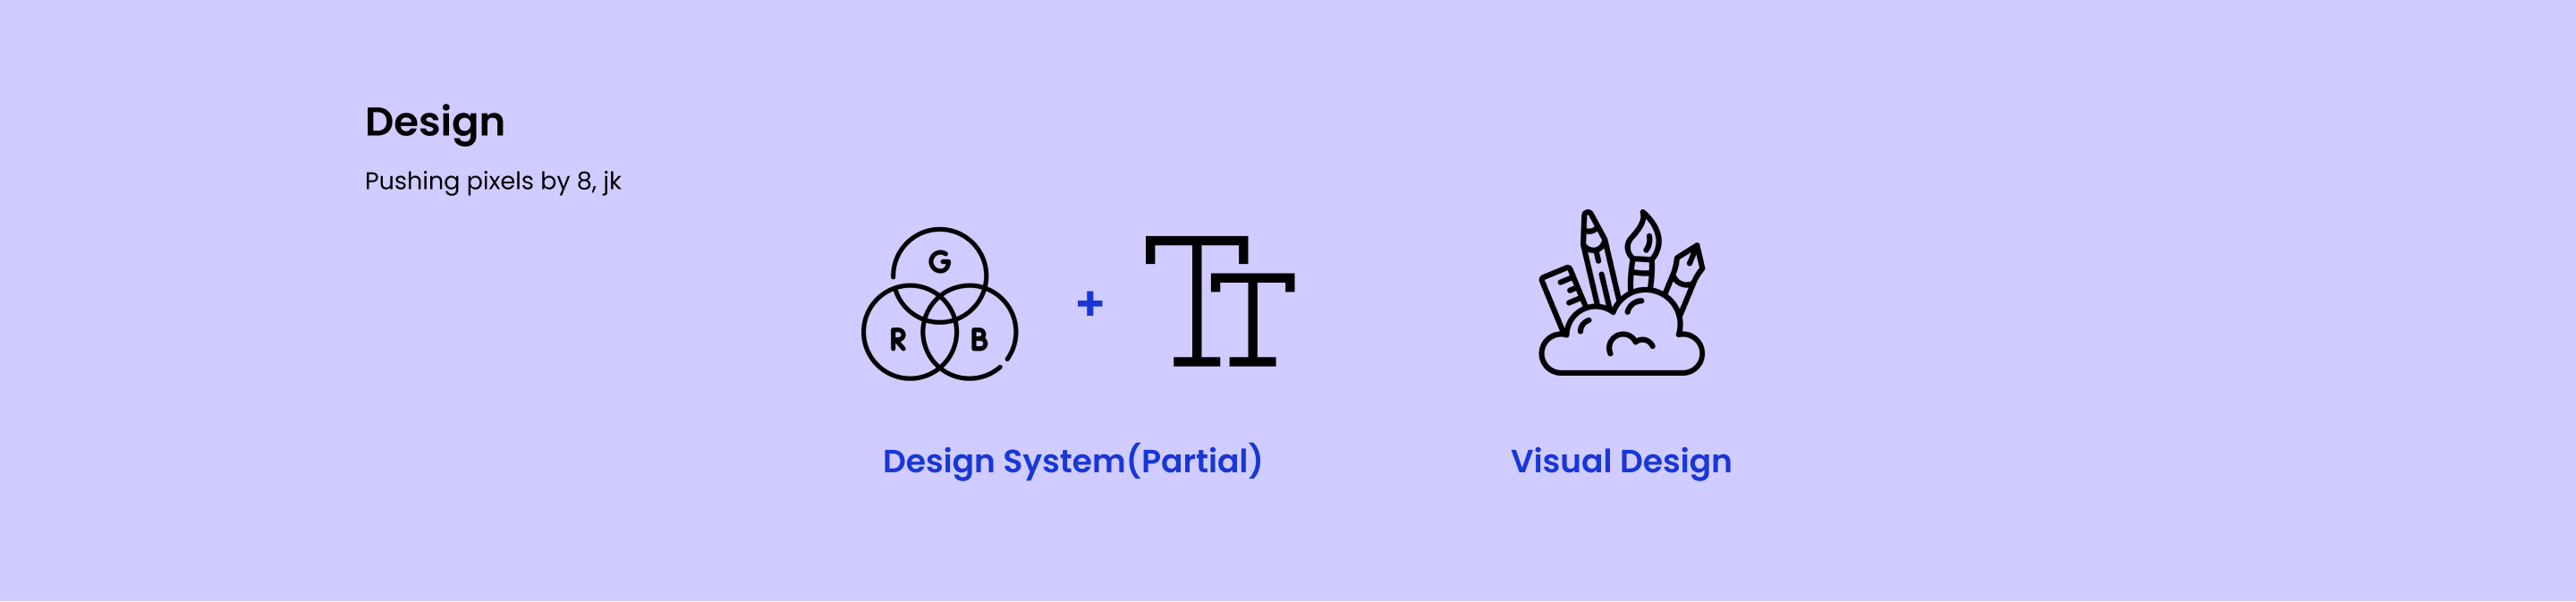
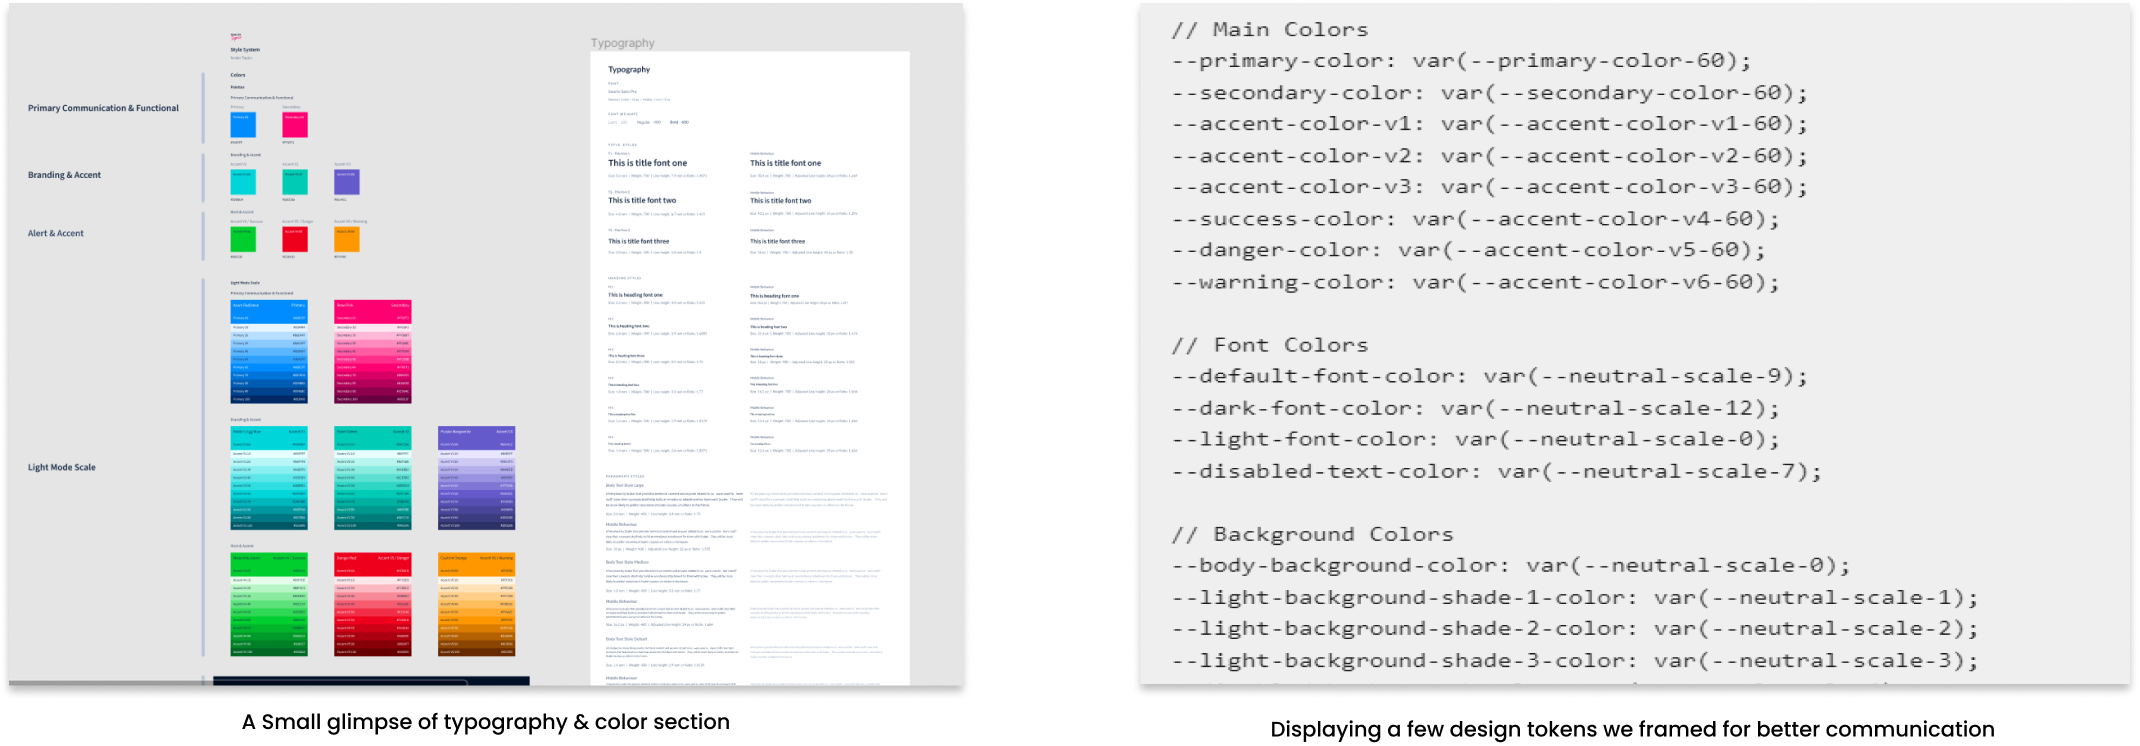
After finalising the overall structure & flow, we moved out on the final work i.e. Visual Design. We first started with making our Design system, as previously we don’t have a universal design system, so this is a good chance for us to work on that. For now we’ve defined the typography and color palletes that we need to use in that, here communicating with dev team is one of the very important thing, as the design tokens could be named only after the collaboration.
Once we have our foundations i.e. - Colors, Typography, Grids, spacing, layout & elevation defined, we moved out on making necessary components, I used the word necessary because, we need to build things fast so at that current moment, we don’t go for building all componets, but one those are needed immediately like text-fields, buttons etc.
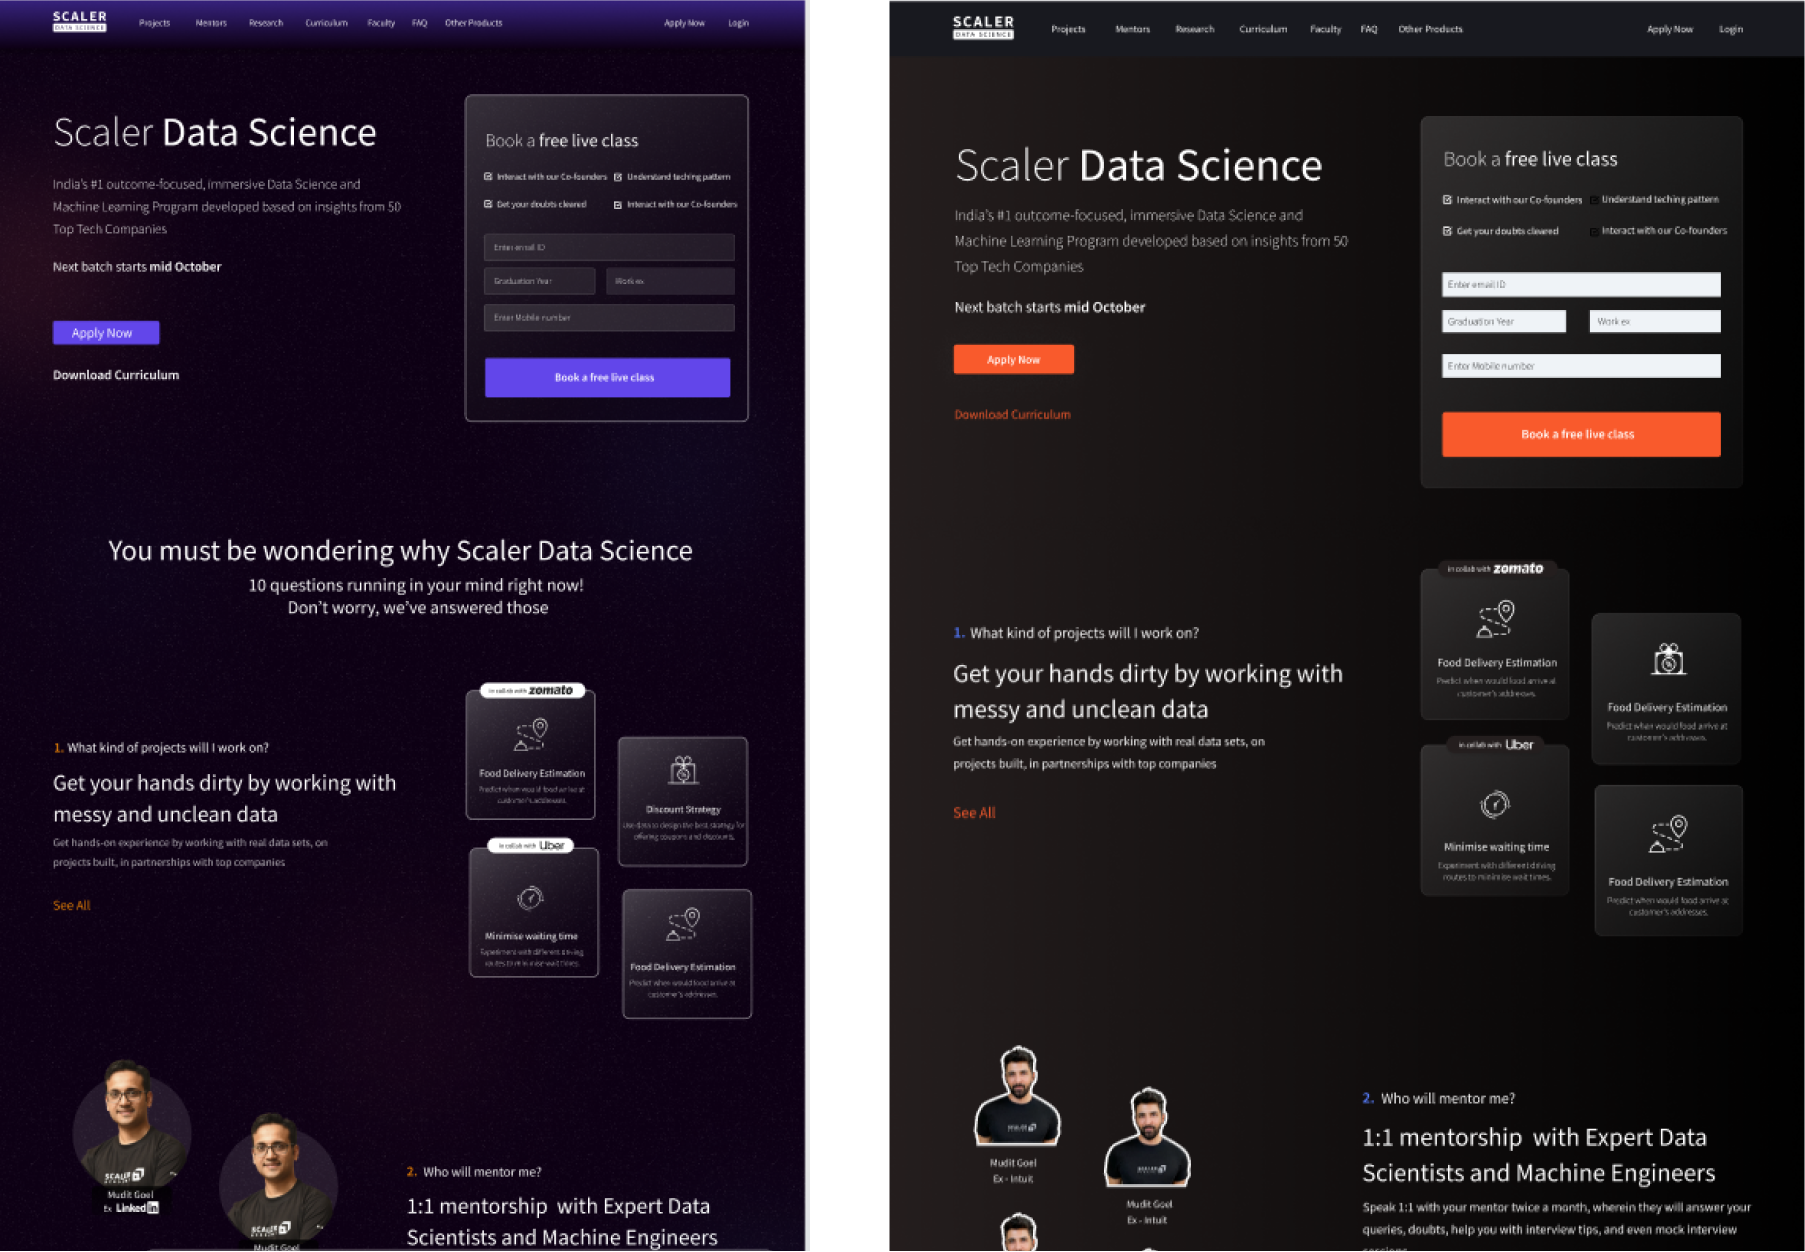
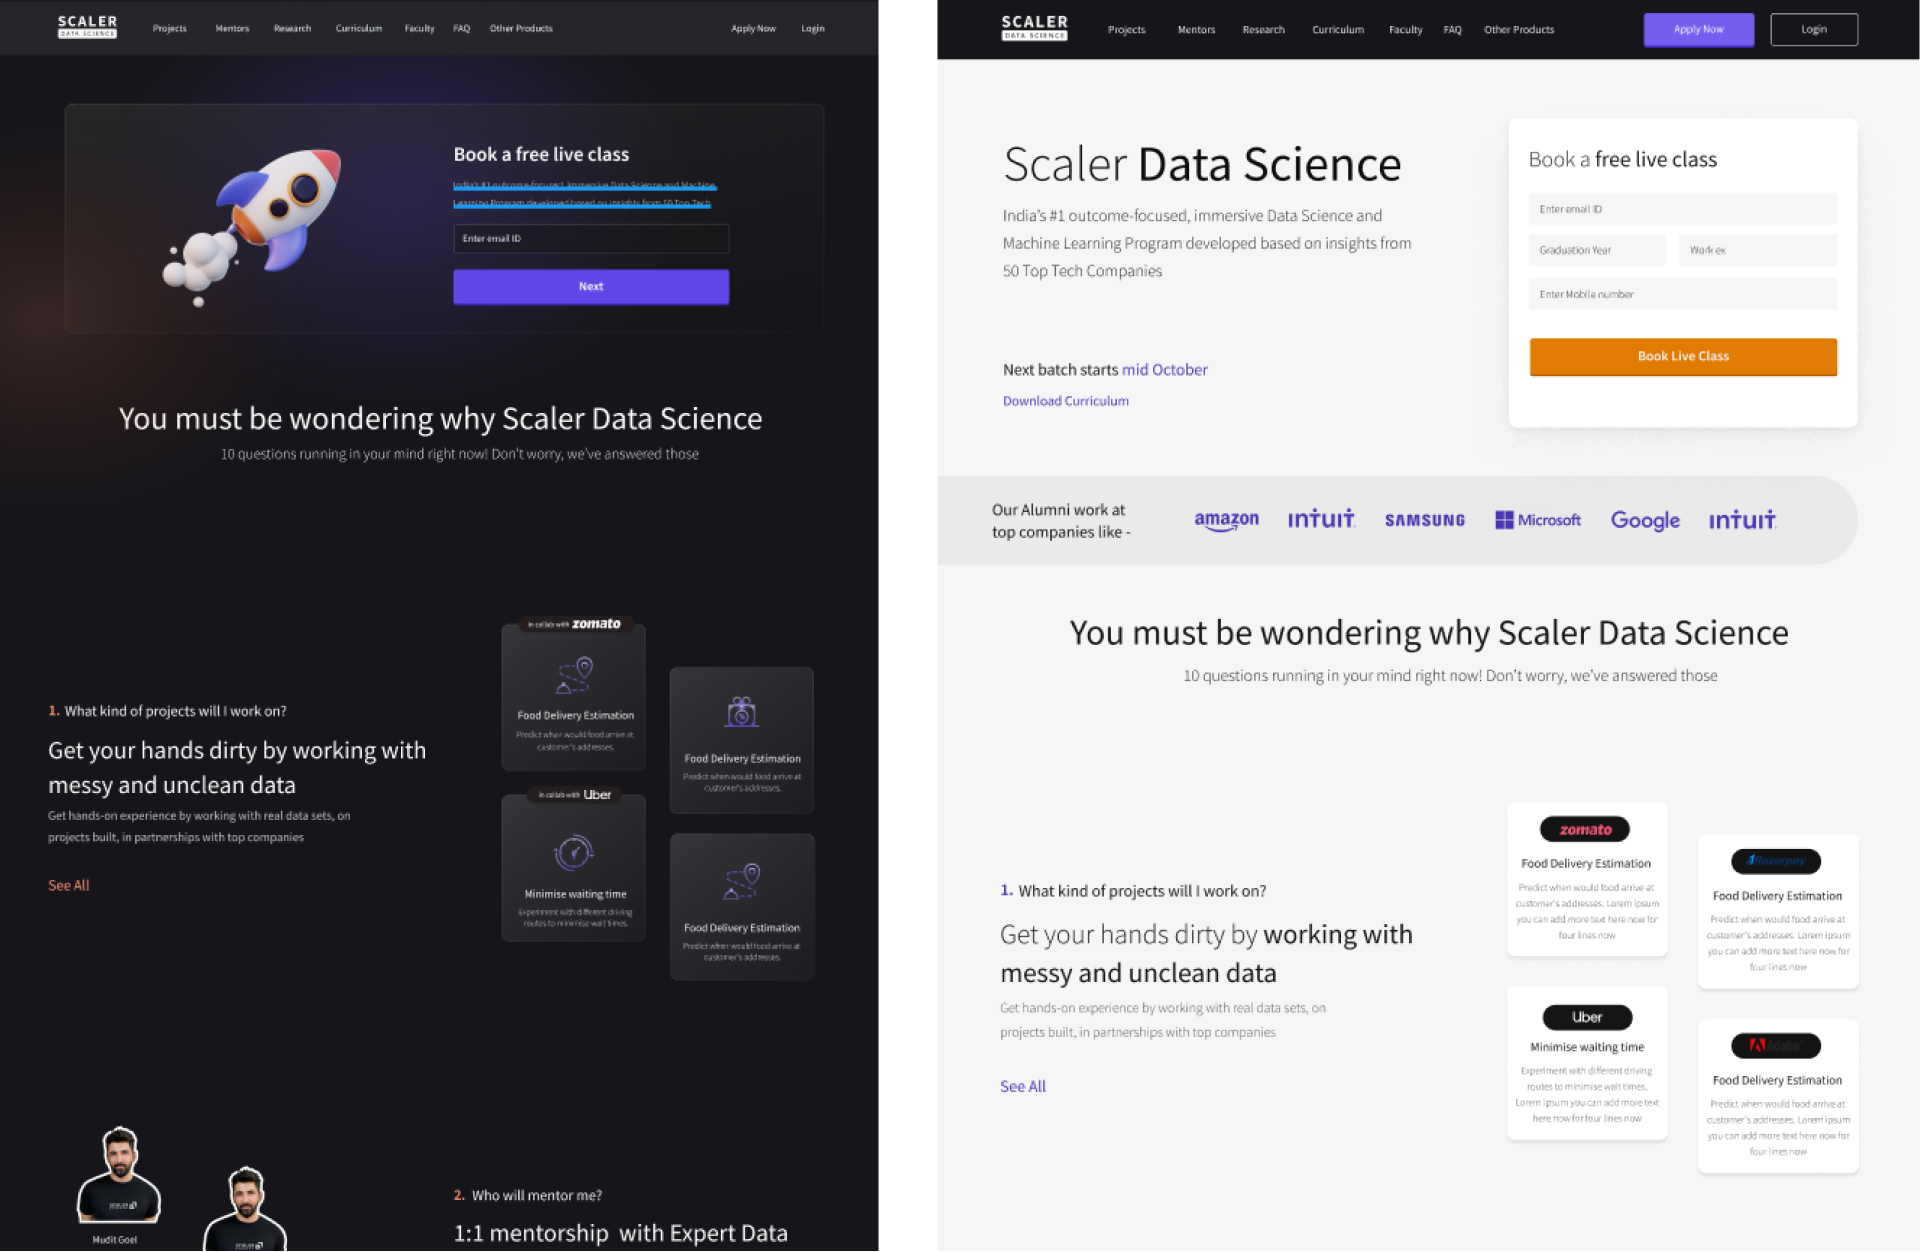
Also deciding a color theme is bit challenging for us, we tried mutliple themes and variants, Data-Science course is a kind of premium course, as it’s fees as well as ROI is very high, generally ML folks earns a lot in tech indutsry, so we want to make sure the overall website gives a premium feeling, thus we decided to go with a dark theme with a touch of glassmorphism.
Multiple themes and iterations we did, showing a few here
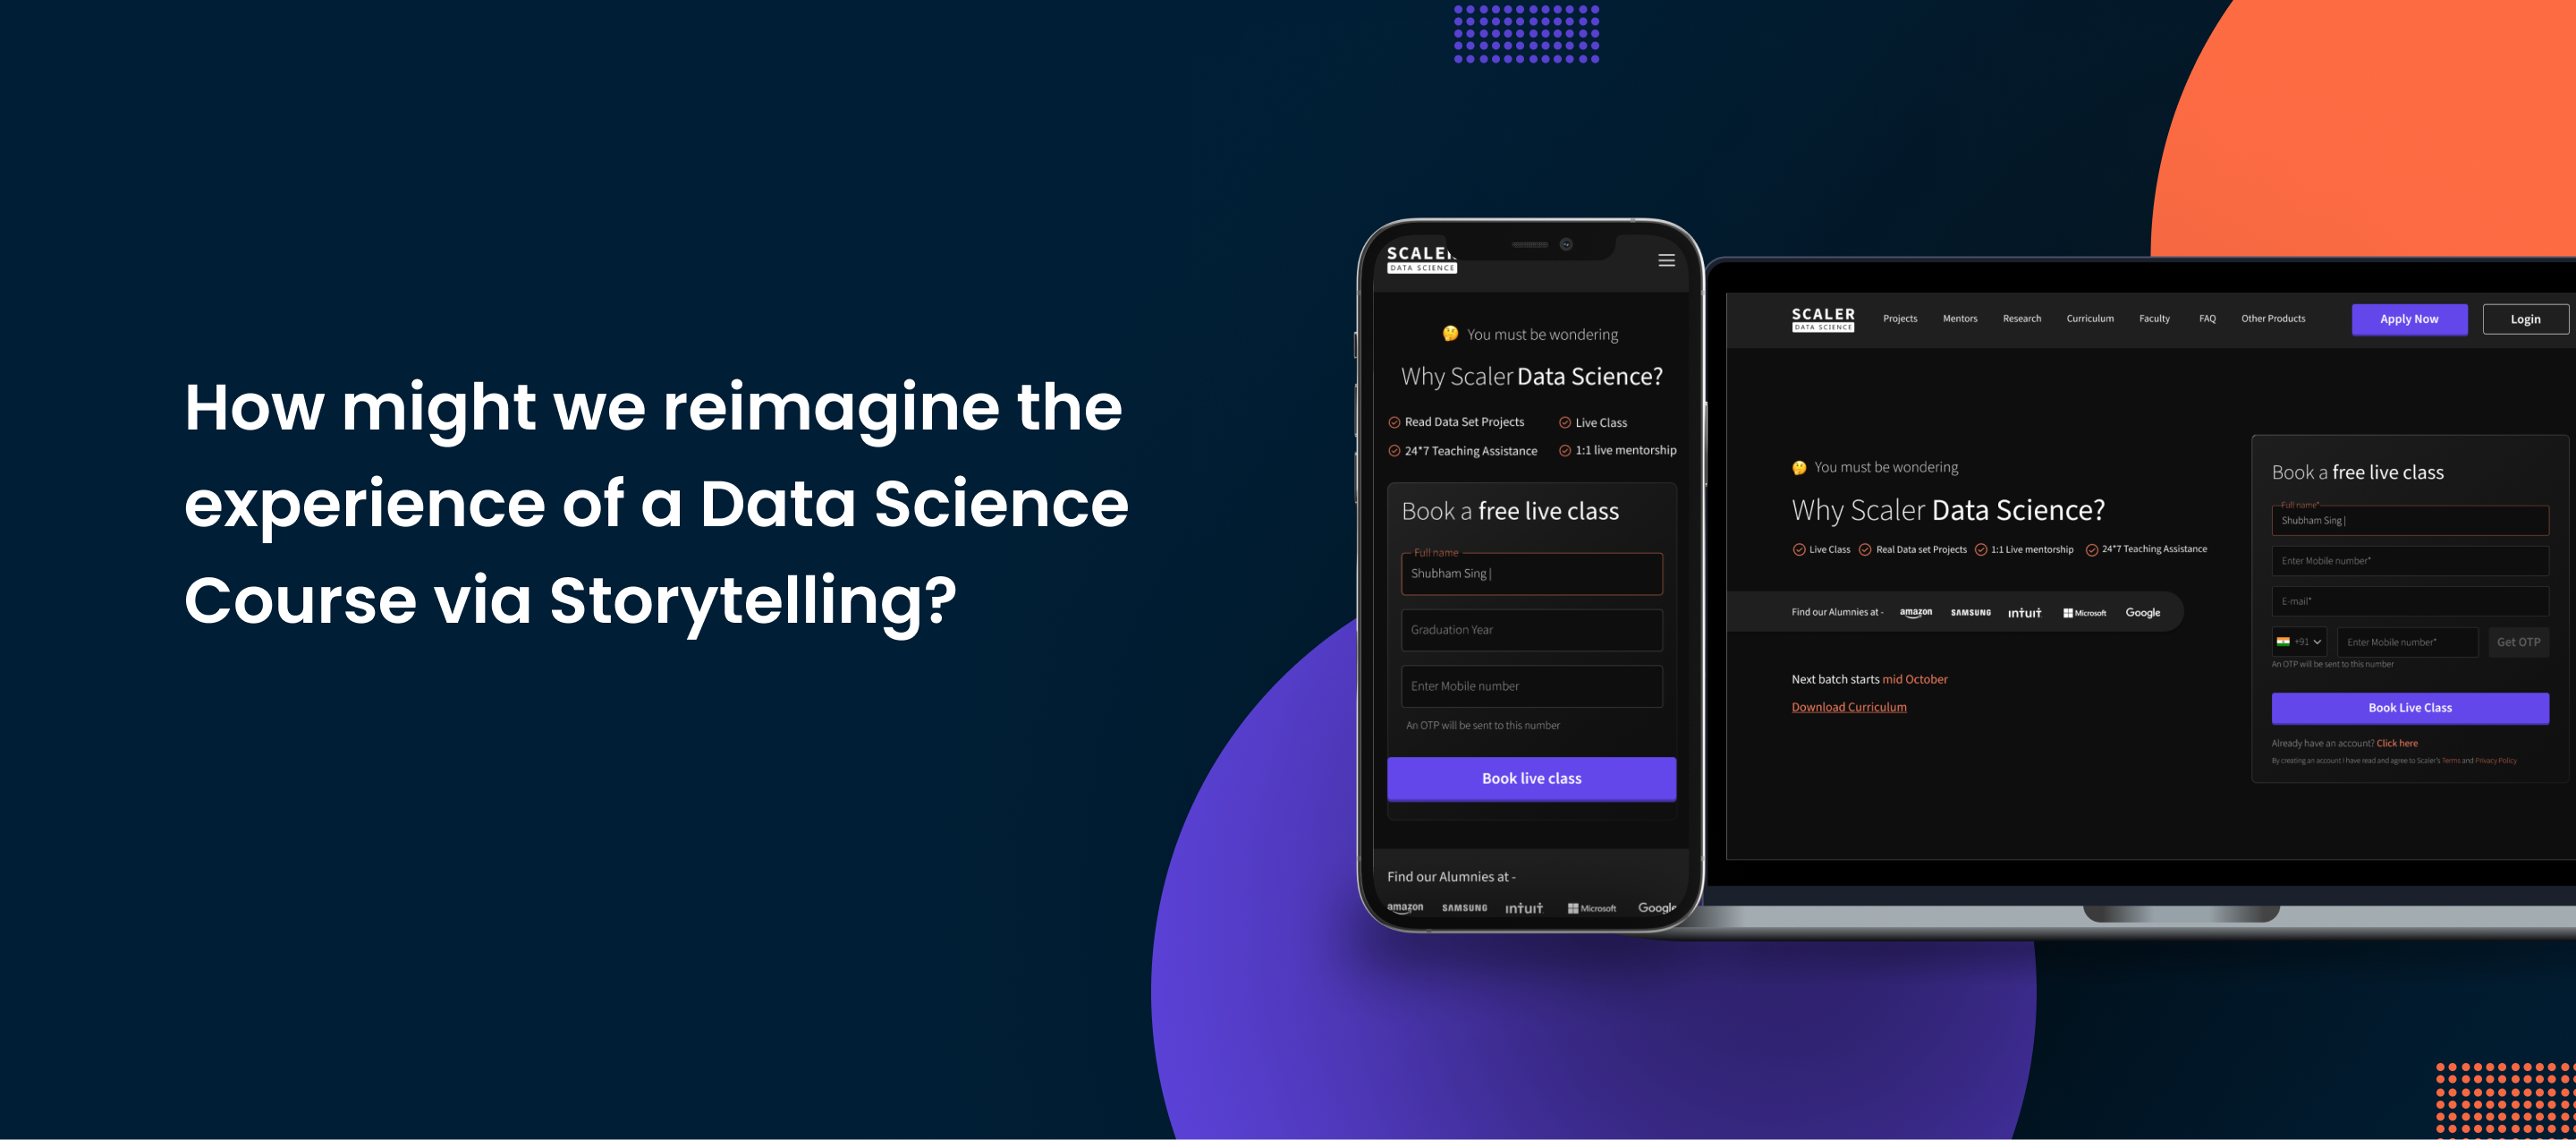
After going through all the iterations, we have finallized one them and thereafter designed the website by using the defined guidelines, as I said earlier we want to make a storytelling experience for our users, so rather than lisitng all the features we do have, we put them in questions format, as the end goal of a person who’s coming to any website is to solve their respective problems, now this way we won’t only helping getting more leads, but we are truly helping our users in finding out for what & why they come on our website 😎
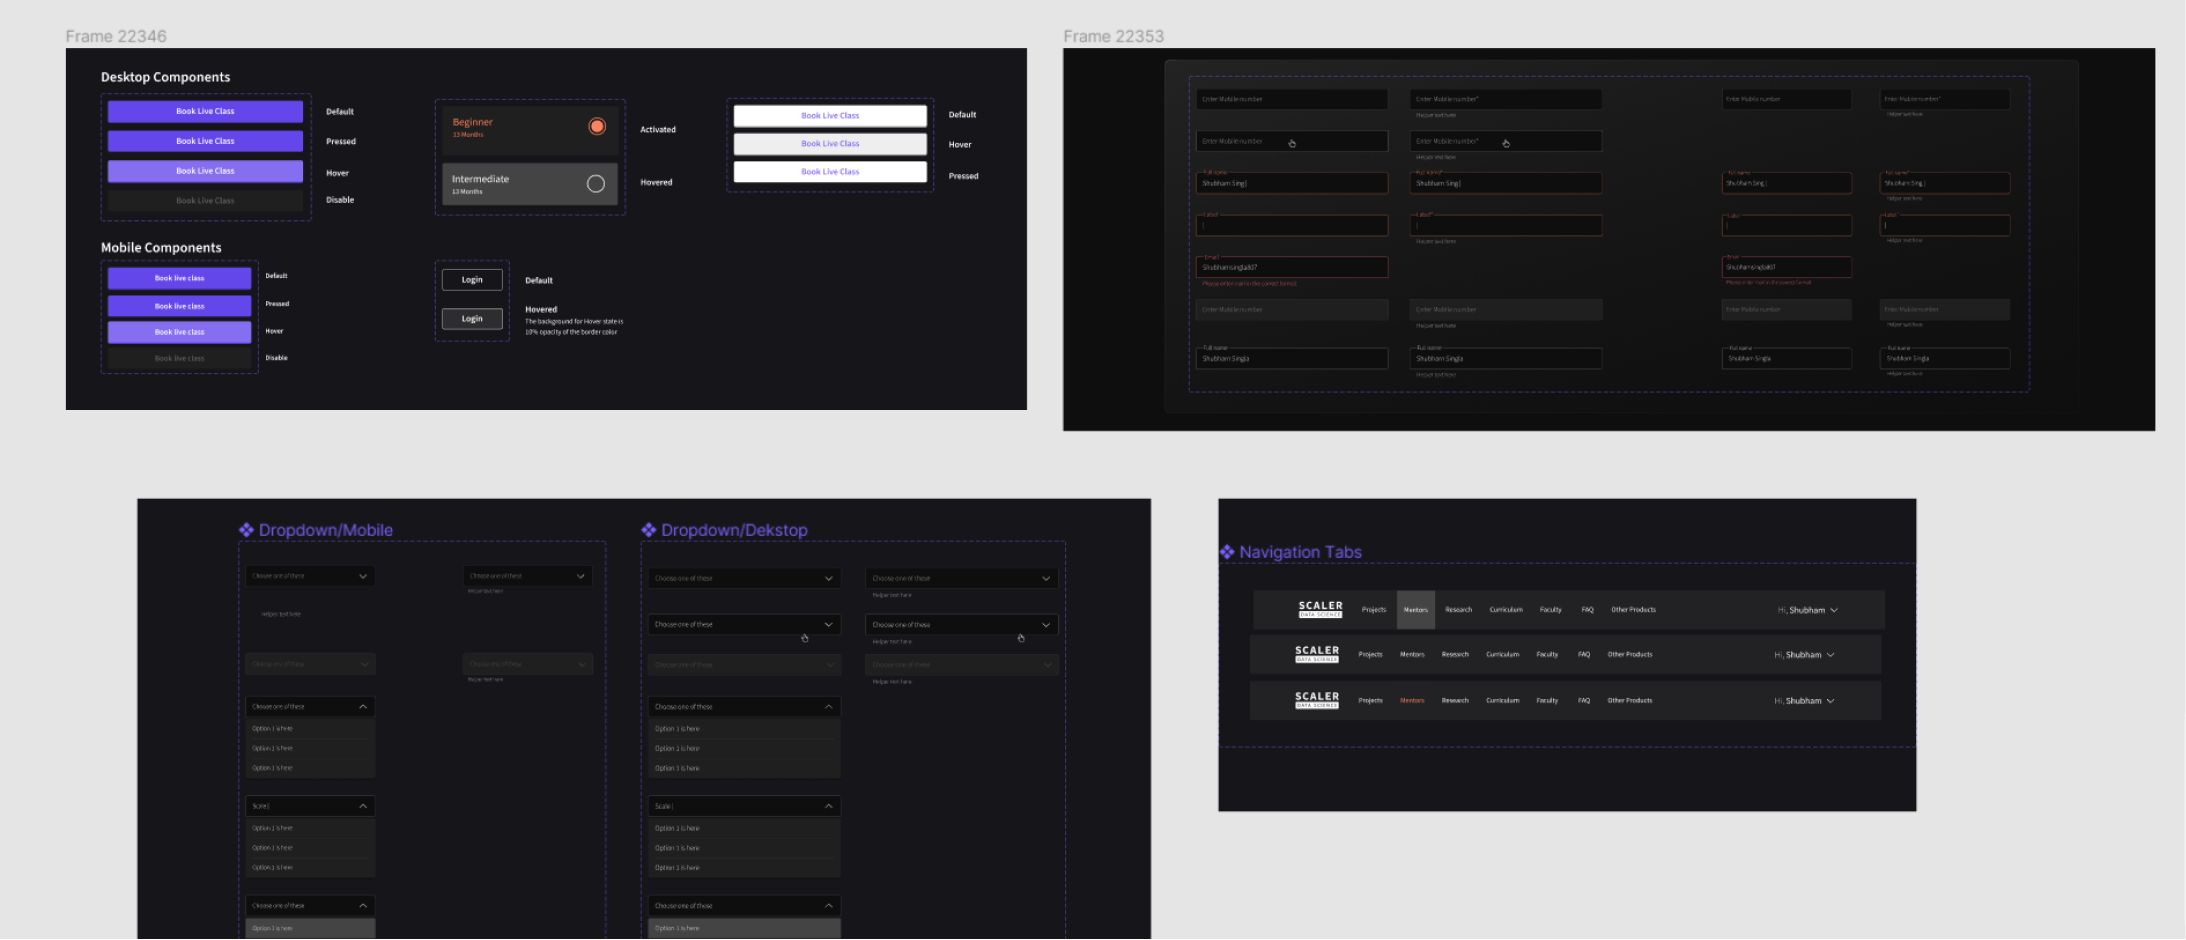
Here comes the components, displaying a few from our library
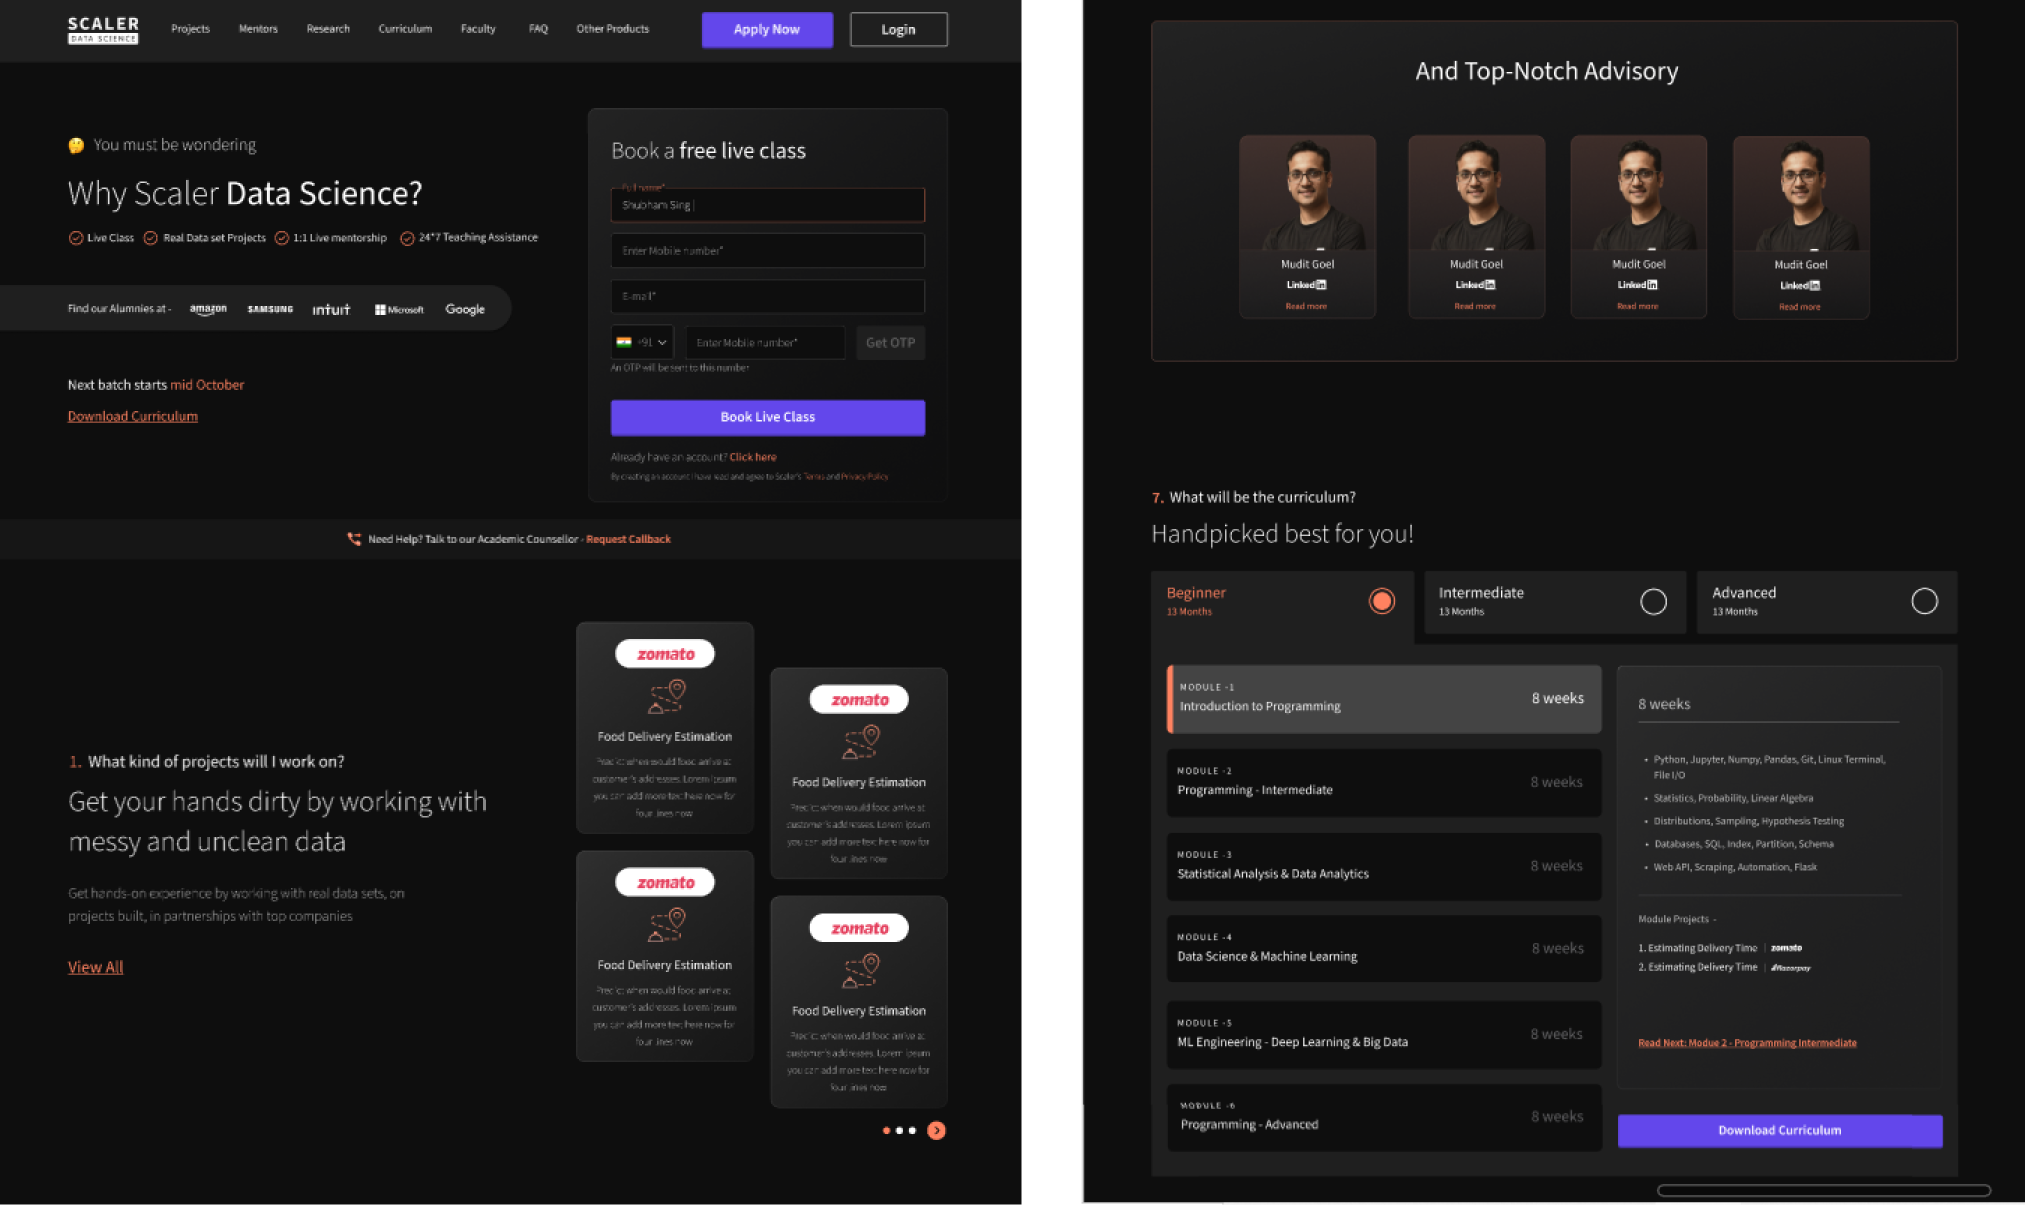
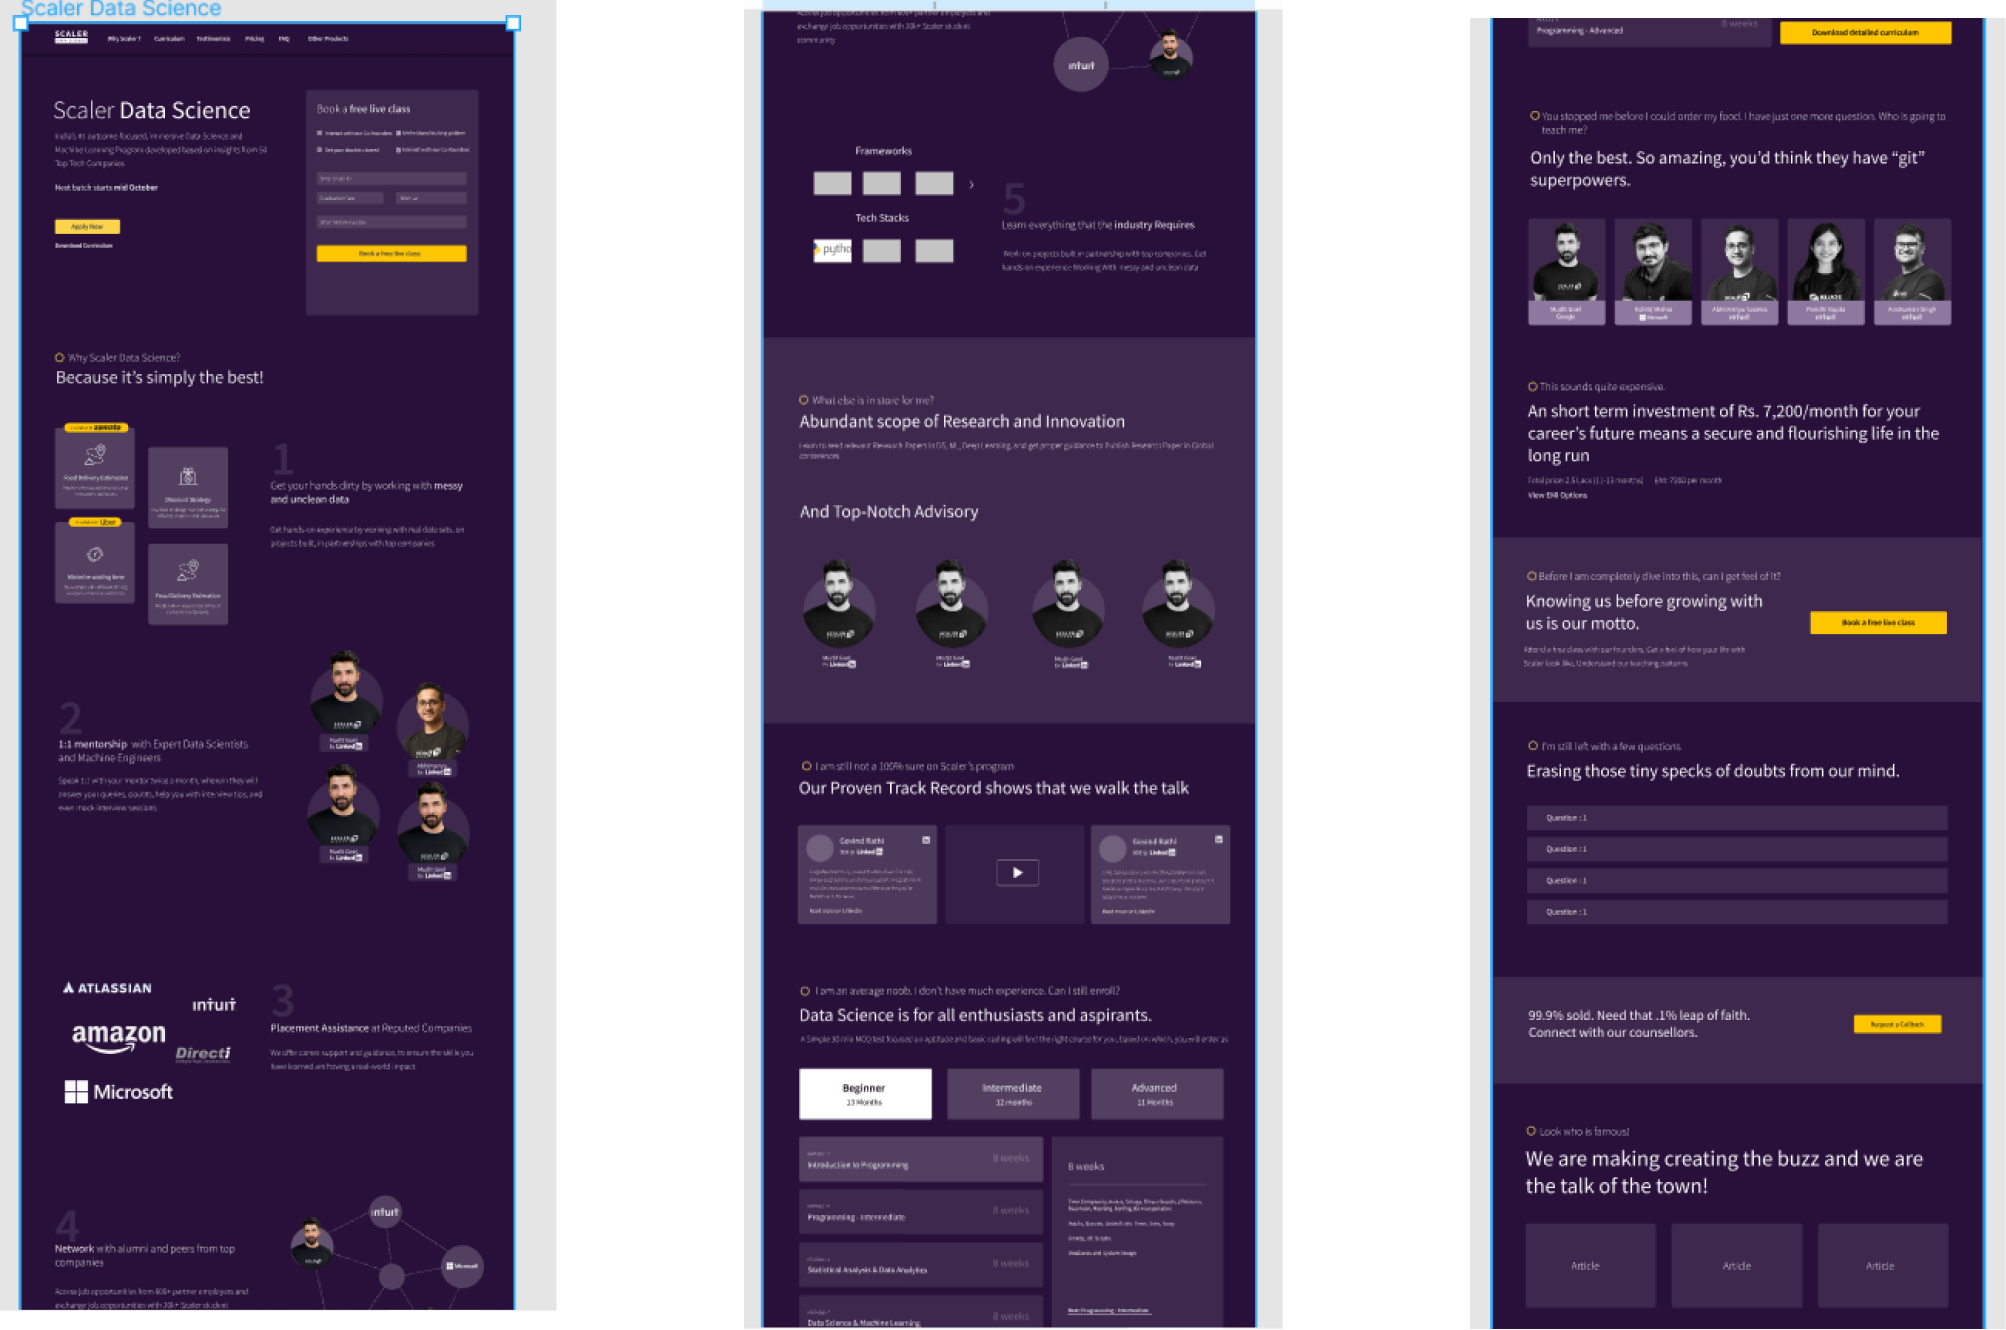
Showing few sections of the final design, whole product could be found here
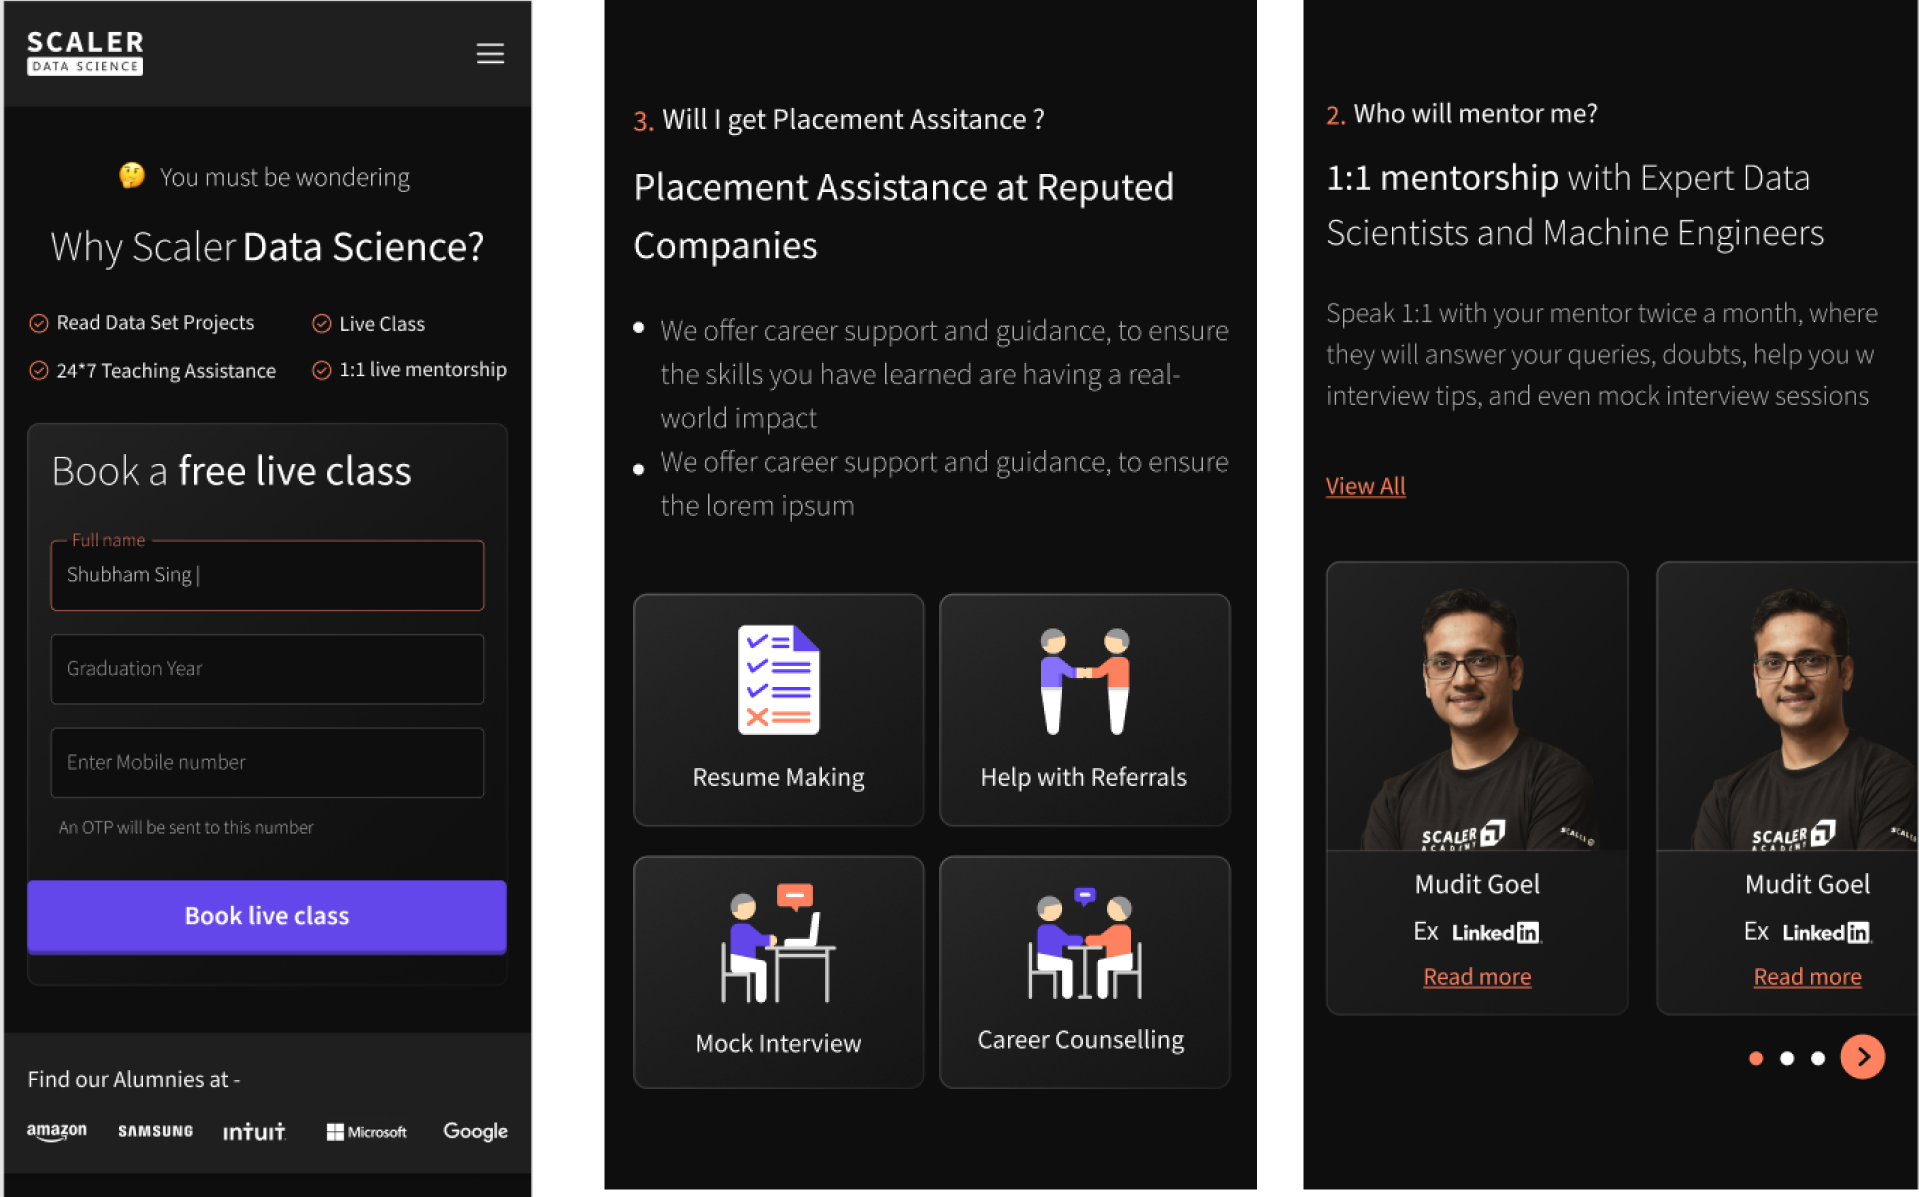
From the Microsoft Clarity and GA (Analytics tool), we saw a larger audience is coming from mobile as well, so building a good experience for mobile is cruciual as same as for the web. Here are the few design screens for the mobile users as well -
After aligning all the stakeholders with the design, we collaborated with the dev team to ship pixel perfect design. We try to work along the flexbox and grids they’re using and handed off the design with redlines. Few screenshots showing the hand off here -
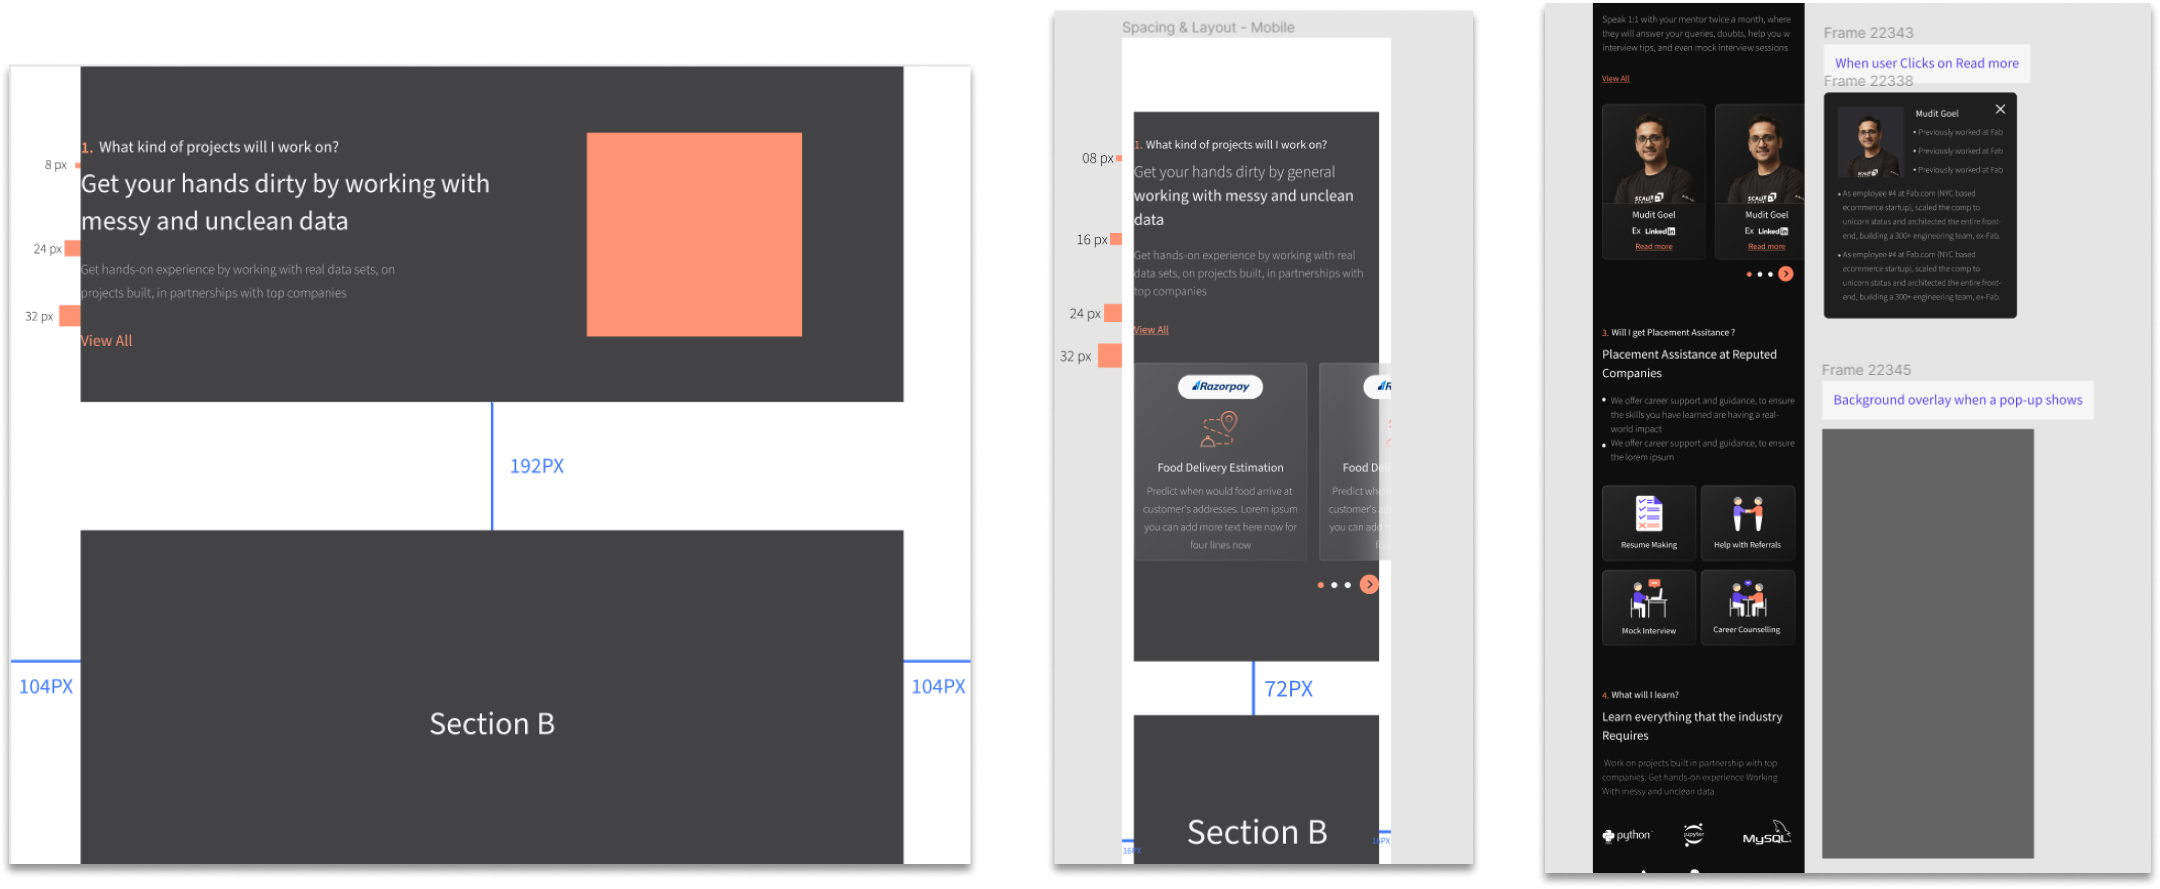
Handoff with Redlines
To make sure we’re getting the right growth we decided to measure various metrics, even we installed Microscoft Clarity in DSc page to check data of the old page that is live already, few metrics that we look for -